#GBPUSD @ 1.24231 attracts some intraday buying in reaction to stronger UK inflation data. (Pivot Orderbook analysis)
…
This is a premium post.
[s2If !current_user_can(access_s2member_level4)]Please register for FREE REGISTER to read full post below containing analysis. In case of any error or you think you are not able to read the full post below, please email us at support#nehcap.com [lwa][/s2If] [s2If current_user_can(access_s2member_level1)]
- GBP/USD attracts some intraday buying in reaction to stronger UK inflation data.
- Expectations for fewer BoE rate hikes cap any further gains amid a bullish USD.
- Investors now look to the FOMC meeting minutes for a fresh directional impetus.
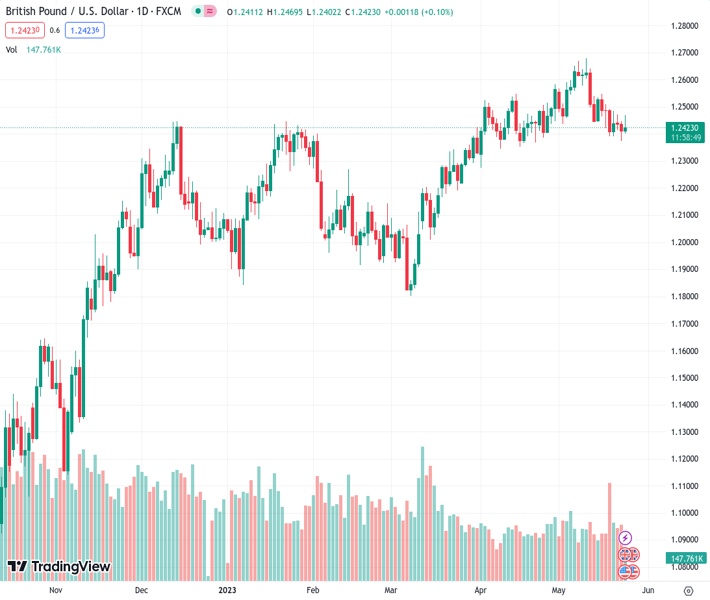
The pair currently trades last at 1.24231.
The previous day high was 1.2446 while the previous day low was 1.2373. The daily 38.2% Fib levels comes at 1.2401, expected to provide support. Similarly, the daily 61.8% fib level is at 1.2418, expected to provide support.
The GBP/USD pair fades an intraday bullish spike to the 1.2470 region and retreats to the lower end of its daily trading range during the first half of the European session. The pair is currently placed around the 1.2420 area and seems vulnerable to prolonging its recent retracement slide witnessed over the past two weeks or so.
The British Pound (GBP) did get a minor lift in a knee-jerk reaction to the release of stronger-than-expected UK inflation figures, though the intraday uptick runs out of steam rather quickly. The Office for National Statistics reported that the headline UK CPI rose 8.7% YoY in April as compared to consensus estimates for a reading of 8.2%. This, however, marks a sharp deceleration from the 10.1% YoY rate registered in March, reaffirming expectations that fewer rate increases by the Bank of England (BoE) will be needed in the coming months to bring down inflation. This, along with the underlying bullish sentiment surrounding the US Dollar (USD), contributes to capping the upside for the GBP/USD pair.
In fact, the USD Index (DXY), which tracks the Greenback against a basket of currencies, stands tall near a two-month high set on Tuesday and continues to draw support from the possibility of further rate hikes by the Federal Reserve (Fed). The speculations were fueled by the recent hawkish comments by several Fed officials, suggesting that the US central bank will keep rates higher for longer. Apart from this, a softer risk tone – amid worries about the slowing global economy and the US debt ceiling woes – further benefits the Greenback’s relative safe-haven status. This, in turn, attracts some sellers around the GBP/USD pair, though the downside remains cushioned ahead of the release of the FOMC minutes.
Investors will look for fresh clues about the Fed’s rate-hike path, which will play a key role in influencing the near-term USD price dynamics and provide a fresh directional impetus to the GBP/USD pair. Nevertheless, the aforementioned fundamental backdrop seems tilted in favour of bearish traders and suggests that the path of least resistance for spot prices is to the downside. Even from a technical perspective, the overnight breakdown below the 50-day Simple Moving Average (SMA) supports prospects for an extension of the pullback from over a one-year high touched earlier this month.
Technical Levels: Supports and Resistances
GBPUSD currently trading at 1.2425 at the time of writing. Pair opened at 1.2411 and is trading with a change of 0.11 % .
| Overview | Overview.1 | |
|---|---|---|
| 0 | Today last price | 1.2425 |
| 1 | Today Daily Change | 0.0014 |
| 2 | Today Daily Change % | 0.1100 |
| 3 | Today daily open | 1.2411 |
The pair is trading below its 20 Daily moving average @ 1.2515, above its 50 Daily moving average @ 1.2421 , above its 100 Daily moving average @ 1.2278 and above its 200 Daily moving average @ 1.1972
| Trends | Trends.1 | |
|---|---|---|
| 0 | Daily SMA20 | 1.2515 |
| 1 | Daily SMA50 | 1.2421 |
| 2 | Daily SMA100 | 1.2278 |
| 3 | Daily SMA200 | 1.1972 |
The previous day high was 1.2446 while the previous day low was 1.2373. The daily 38.2% Fib levels comes at 1.2401, expected to provide support. Similarly, the daily 61.8% fib level is at 1.2418, expected to provide support.
Note the levels of interest below:
- Pivot support is noted at 1.2374, 1.2337, 1.23
- Pivot resistance is noted at 1.2448, 1.2484, 1.2521
| Levels | Levels.1 |
|---|---|
| Previous Daily High | 1.2446 |
| Previous Daily Low | 1.2373 |
| Previous Weekly High | 1.2547 |
| Previous Weekly Low | 1.2392 |
| Previous Monthly High | 1.2584 |
| Previous Monthly Low | 1.2275 |
| Daily Fibonacci 38.2% | 1.2401 |
| Daily Fibonacci 61.8% | 1.2418 |
| Daily Pivot Point S1 | 1.2374 |
| Daily Pivot Point S2 | 1.2337 |
| Daily Pivot Point S3 | 1.2300 |
| Daily Pivot Point R1 | 1.2448 |
| Daily Pivot Point R2 | 1.2484 |
| Daily Pivot Point R3 | 1.2521 |
[/s2If]
Nehcap Expert Advisor
The NEHCAP MT4 EA is high quality professional trading system geared to generate returns without using GRID or martingales. Each trade has strict risk per trade parameter. The pairs under management include EURUSD, GBPUSD, AUDCAD, AUDNZD,GBPAUD, EURAUD, EURCAD, CHFJPY and many more.
The system is trading live: LIVE ACCOUNT TRACKING
You can run it free. Apply for a free trial and track our account. Buy the system or use profit share mechanism to generate returns on your MT4.
Join Our Telegram Group
")


