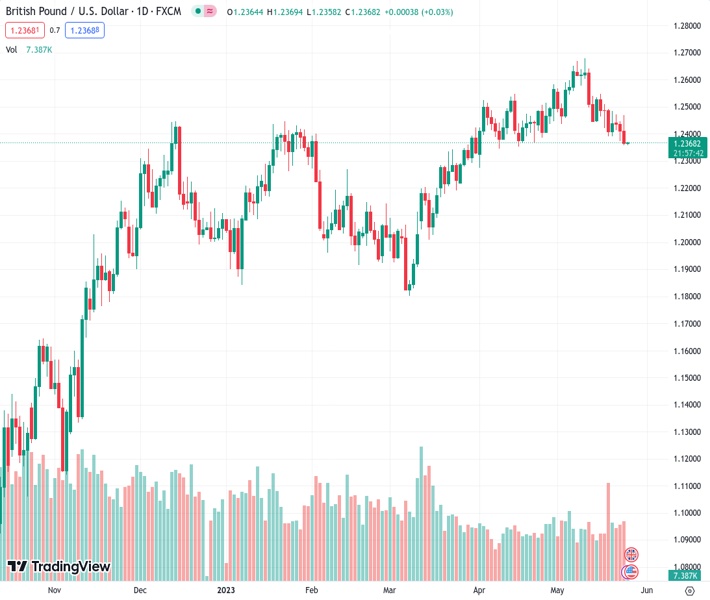
#GBPUSD @ 1.23684 is struggling in defending its downside amid sheer strength in the US Dollar Index. (Pivot Orderbook analysis)
…
This is a premium post.
[s2If !current_user_can(access_s2member_level4)]Please register for FREE REGISTER to read full post below containing analysis. In case of any error or you think you are not able to read the full post below, please email us at support#nehcap.com [lwa][/s2If] [s2If current_user_can(access_s2member_level1)]
- GBP/USD is struggling in defending its downside amid sheer strength in the US Dollar Index.
- Republicans are not agreeing to the tax increase and higher spending proposed for the budget by congressional Democrats.
- GBP/USD is challenging the demand zone placed in a narrow range of 1.2344-1.2356.
The pair currently trades last at 1.23684.
The previous day high was 1.2446 while the previous day low was 1.2373. The daily 38.2% Fib levels comes at 1.2401, expected to provide resistance. Similarly, the daily 61.8% fib level is at 1.2418, expected to provide resistance.
The GBP/USD pair looks vulnerable above the immediate support of 1.2360 in the early Asian session. The Cable is struggling in defending its downside amid sheer strength in the US Dollar Index due to the long-awaited US debt-ceiling raise by the White House.
Wednesday’s negotiations on US borrowing cap issues remained positive among the White House and Republicans, however, the latter are not agreeing to tax increases and higher spending proposed for the budget by congressional Democrats.
S&P500 futures have added stellar gains in early Asia after a sell-off on Wednesday, portraying a recovery in the overall risk-off market mood.
The Pound Sterling remained in the spotlight after the release of the United Kingdom’s inflation data on Wednesday.
GBP/USD is challenging the demand zone placed in a narrow range of 1.2344-1.2356 on a four-hour scale. The Cable is auctioning in a Falling Channel chart pattern in which each pullback is considered a selling opportunity by the market participants.
The Pound Sterling bulls are consistently facing barricades from the 20-period Exponential Moving Average (EMA) around 1.2412.
Meanwhile, the Relative Strength Index (RSI) (14) has slipped into the bearish range of 20.00-40.00, which indicates that the downside momentum has been triggered.
Should the asset decline below April 10 low at 1.2344, US Dollar bulls will get strengthened further and will drag the Cable toward April 03 low at 1.2275, followed by March 14 high at 1.2204.
On the flip side, a recovery move above May 09 high at 1.2640 will drive the major toward the round-level resistance at 1.2700 and 26 April 2022 high at 1.2772.
Technical Levels: Supports and Resistances
GBPUSD currently trading at 1.2362 at the time of writing. Pair opened at 1.2411 and is trading with a change of -0.39 % .
| Overview | Overview.1 | |
|---|---|---|
| 0 | Today last price | 1.2362 |
| 1 | Today Daily Change | -0.0049 |
| 2 | Today Daily Change % | -0.3900 |
| 3 | Today daily open | 1.2411 |
The pair is trading below its 20 Daily moving average @ 1.2515, below its 50 Daily moving average @ 1.2421 , above its 100 Daily moving average @ 1.2278 and above its 200 Daily moving average @ 1.1972
| Trends | Trends.1 | |
|---|---|---|
| 0 | Daily SMA20 | 1.2515 |
| 1 | Daily SMA50 | 1.2421 |
| 2 | Daily SMA100 | 1.2278 |
| 3 | Daily SMA200 | 1.1972 |
The previous day high was 1.2446 while the previous day low was 1.2373. The daily 38.2% Fib levels comes at 1.2401, expected to provide resistance. Similarly, the daily 61.8% fib level is at 1.2418, expected to provide resistance.
Note the levels of interest below:
- Pivot support is noted at 1.2374, 1.2337, 1.23
- Pivot resistance is noted at 1.2448, 1.2484, 1.2521
| Levels | Levels.1 |
|---|---|
| Previous Daily High | 1.2446 |
| Previous Daily Low | 1.2373 |
| Previous Weekly High | 1.2547 |
| Previous Weekly Low | 1.2392 |
| Previous Monthly High | 1.2584 |
| Previous Monthly Low | 1.2275 |
| Daily Fibonacci 38.2% | 1.2401 |
| Daily Fibonacci 61.8% | 1.2418 |
| Daily Pivot Point S1 | 1.2374 |
| Daily Pivot Point S2 | 1.2337 |
| Daily Pivot Point S3 | 1.2300 |
| Daily Pivot Point R1 | 1.2448 |
| Daily Pivot Point R2 | 1.2484 |
| Daily Pivot Point R3 | 1.2521 |
[/s2If]
Nehcap Expert Advisor
The NEHCAP MT4 EA is high quality professional trading system geared to generate returns without using GRID or martingales. Each trade has strict risk per trade parameter. The pairs under management include EURUSD, GBPUSD, AUDCAD, AUDNZD,GBPAUD, EURAUD, EURCAD, CHFJPY and many more.
The system is trading live: LIVE ACCOUNT TRACKING
You can run it free. Apply for a free trial and track our account. Buy the system or use profit share mechanism to generate returns on your MT4.
Join Our Telegram Group
")


