#GBPJPY @ 172.252 Despite trading within a range, the maintains an upward bias, bolstered by UK inflation figures and expectations of further tightening by the Bank of England. (Pivot Orderbook analysis)
…
This is a premium post.
[s2If !current_user_can(access_s2member_level4)]Please register for FREE REGISTER to read full post below containing analysis. In case of any error or you think you are not able to read the full post below, please email us at support#nehcap.com [lwa][/s2If] [s2If current_user_can(access_s2member_level1)]
- Despite trading within a range, the GBP/JPY maintains an upward bias, bolstered by UK inflation figures and expectations of further tightening by the Bank of England.
- GBP/JPY faces a potential pullback, suggested by the negative divergence between its price action and the Relative Strength Index (RSI), with support at 172.00 and the 20-day EMA at 170.27.
- Further gains may be expected if GBP/JPY surpasses 173.00, with the falling wedge measuring an objective of 174.30.
The pair currently trades last at 172.252.
The previous day high was 172.63 while the previous day low was 171.29. The daily 38.2% Fib levels comes at 171.8, expected to provide support. Similarly, the daily 61.8% fib level is at 172.12, expected to provide support.
GBP/JPY clings to the 172.00 figure amidst a risk-off impulse as the US debt ceiling woes and the release of the US Federal Reserve (Fed) May minutes loom. Therefore, investors seeking safety moved toward safe-haven peers, except for the Japanese Yen (JPY), weakening against the Pound Sterling (GBP). At the time of writing, the GBP/JPY is trading around 172.30s.
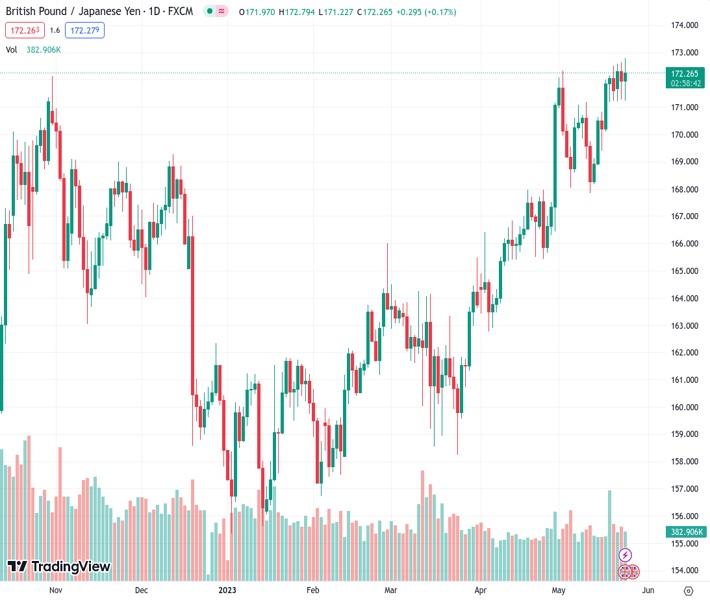
The GBP/JPY continues to trade within a range between the 171.22-172.79 area after inflation figures in the United Kingdom (UK) cooled down, except for the April Core Consumer Price Index (CPI) jumping by 6.8%, above the prior’s month and the consensus 6.2%. That underpinned the GBP as expectations for additional tightening by the Bank of England (BoE) increased.
The GBP/JPY is still upward biased, but since the break of a falling wedge, the pair’s rally towards the measured objective at 174.30 stalled. In n article written on May 23, I wrote: “After three consecutive sessions, the GBP/JPY failed to reach the 173.00 area, which, once cleared, could pave the way towards the 174.00 figure, ahead of getting the measured objective of the falling wedge.” However, Wednesday what no exception to the rule, as the GBP/JPY reached a high of 172.79 but retreated more than 50 pips, oscillating around 172.20s.
As the GBP/JPY price action achieved successive higher highs, the Relative Strength Index (RSI) indicator prints lower peaks. That means a negative divergence between price action and the RSI could open the door for a pullback.
Hence, the GBP/JPY first support is the 172.00 mark. A break below and the GBP/JPY will reach the 20-day Exponential Moving Average (EMA) at 170.27, with the 170.00 figure up for grabs.
On the flip side, if GBP/JPY hits 173.00, that could pave the way for further gains, lile the falling wedge measured an objective of 174.30.
Technical Levels: Supports and Resistances
GBPJPY currently trading at 172.28 at the time of writing. Pair opened at 172.01 and is trading with a change of 0.16 % .
| Overview | Overview.1 | |
|---|---|---|
| 0 | Today last price | 172.28 |
| 1 | Today Daily Change | 0.27 |
| 2 | Today Daily Change % | 0.16 |
| 3 | Today daily open | 172.01 |
The pair remains strongly bullish on the daily timeframe. It trades above its 20 SMA @ 170.23, 50 SMA 166.53, 100 SMA @ 163.66 and 200 SMA @ 164.02.
| Trends | Trends.1 | |
|---|---|---|
| 0 | Daily SMA20 | 170.23 |
| 1 | Daily SMA50 | 166.53 |
| 2 | Daily SMA100 | 163.66 |
| 3 | Daily SMA200 | 164.02 |
The previous day high was 172.63 while the previous day low was 171.29. The daily 38.2% Fib levels comes at 171.8, expected to provide support. Similarly, the daily 61.8% fib level is at 172.12, expected to provide support.
Note the levels of interest below:
- Pivot support is noted at 171.32, 170.64, 169.98
- Pivot resistance is noted at 172.66, 173.32, 174.0
| Levels | Levels.1 |
|---|---|
| Previous Daily High | 172.63 |
| Previous Daily Low | 171.29 |
| Previous Weekly High | 172.51 |
| Previous Weekly Low | 168.91 |
| Previous Monthly High | 171.18 |
| Previous Monthly Low | 162.78 |
| Daily Fibonacci 38.2% | 171.80 |
| Daily Fibonacci 61.8% | 172.12 |
| Daily Pivot Point S1 | 171.32 |
| Daily Pivot Point S2 | 170.64 |
| Daily Pivot Point S3 | 169.98 |
| Daily Pivot Point R1 | 172.66 |
| Daily Pivot Point R2 | 173.32 |
| Daily Pivot Point R3 | 174.00 |
[/s2If]
Nehcap Expert Advisor
The NEHCAP MT4 EA is high quality professional trading system geared to generate returns without using GRID or martingales. Each trade has strict risk per trade parameter. The pairs under management include EURUSD, GBPUSD, AUDCAD, AUDNZD,GBPAUD, EURAUD, EURCAD, CHFJPY and many more.
The system is trading live: LIVE ACCOUNT TRACKING
You can run it free. Apply for a free trial and track our account. Buy the system or use profit share mechanism to generate returns on your MT4.
Join Our Telegram Group
")


