#XAUUSD @ 1,975.96 Gold price has shifted comfortably above $1,970.00 ahead of FOMC minutes. (Pivot Orderbook analysis)
…
This is a premium post.
[s2If !current_user_can(access_s2member_level4)]Please register for FREE REGISTER to read full post below containing analysis. In case of any error or you think you are not able to read the full post below, please email us at support#nehcap.com [lwa][/s2If] [s2If current_user_can(access_s2member_level1)]
- Gold price has shifted comfortably above $1,970.00 ahead of FOMC minutes.
- The release of May’s FOMC minutes will provide a detailed explanation behind 25 bps interest rate hike by the Fed.
- Mixed preliminary S&P PMI data (May) weighed on US Treasury yields.
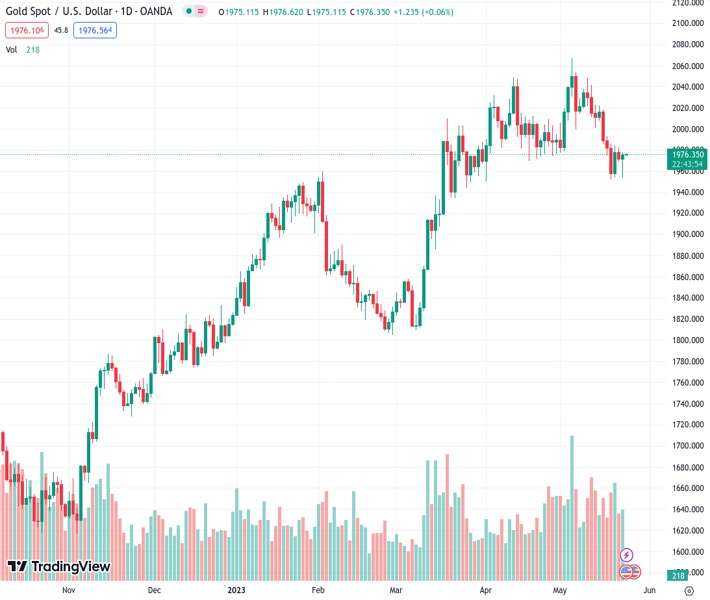
The pair currently trades last at 1975.96.
The previous day high was 1982.63 while the previous day low was 1968.95. The daily 38.2% Fib levels comes at 1974.18, expected to provide support. Similarly, the daily 61.8% fib level is at 1977.4, expected to provide resistance.
Gold price (XAU/USD) has shifted its auction comfortably above the crucial resistance of $1,970.00 in the Asian session. The precious metal is expected to extend its rally further ahead of the release of the Federal Open Market Committee (FOMC) minutes for May’s monetary policy meeting on Wednesday.
S&P500 futures witnessed a steep fall on Tuesday, dragged by a sell-off in technology stocks. The market mood remained negative as the United States economy is getting closer to a situation of default as the Federal government will be out of funds by June 01. An absence of positive development in raising the US debt-ceiling is terrifying investors as a default by the US economy could result in chaos in global financial markets and a spike in interest rates.
The US Dollar Index (DXY) is showing signs of volatility contraction after gaining to near the previous week’s high above 103.60. Going forward, the release of May’s FOMC minutes will provide a detailed explanation behind the 25 basis points (bps) interest rate hike by the Federal Reserve (Fed). Also, it will provide cues about upcoming policy action.
Meanwhile, the release of the mixed preliminary S&P PMI data (May) weighed on US Treasury yields. The Yields offered on 10-year US government bonds dropped below 3.70%.
Gold price has shown a stellar recovery after a Double Bottom formation plotted from May 18 low at $1,952.01, which indicates a bullish reversal. Gold bulls will get further strength after breaking above the immediate resistance placed from March 19 high at $1,984.25. The downward-sloping trendline market from all-time highs at $2,079.76 will act as a major barrier for the Gold price.
The yellow metal has climbed above the 20-period Exponential Moving Average (EMA) at $1,970.00, which indicates that the short-term trend has turned positive.
Meanwhile, the Relative Strength Index (RSI) (14) has shifted into the 40.00-60.00 range from the bearish range of 20.00-40.00, which signals that the downside momentum has faded.
Technical Levels: Supports and Resistances
XAUUSD currently trading at 1975.21 at the time of writing. Pair opened at 1971.9 and is trading with a change of 0.17 % .
| Overview | Overview.1 | |
|---|---|---|
| 0 | Today last price | 1975.21 |
| 1 | Today Daily Change | 3.31 |
| 2 | Today Daily Change % | 0.17 |
| 3 | Today daily open | 1971.90 |
The pair is trading below its 20 Daily moving average @ 2003.78, below its 50 Daily moving average @ 1989.73 , above its 100 Daily moving average @ 1930.4 and above its 200 Daily moving average @ 1826.71
| Trends | Trends.1 | |
|---|---|---|
| 0 | Daily SMA20 | 2003.78 |
| 1 | Daily SMA50 | 1989.73 |
| 2 | Daily SMA100 | 1930.40 |
| 3 | Daily SMA200 | 1826.71 |
The previous day high was 1982.63 while the previous day low was 1968.95. The daily 38.2% Fib levels comes at 1974.18, expected to provide support. Similarly, the daily 61.8% fib level is at 1977.4, expected to provide resistance.
Note the levels of interest below:
- Pivot support is noted at 1966.36, 1960.81, 1952.68
- Pivot resistance is noted at 1980.04, 1988.17, 1993.72
| Levels | Levels.1 |
|---|---|
| Previous Daily High | 1982.63 |
| Previous Daily Low | 1968.95 |
| Previous Weekly High | 2022.18 |
| Previous Weekly Low | 1952.01 |
| Previous Monthly High | 2048.75 |
| Previous Monthly Low | 1949.83 |
| Daily Fibonacci 38.2% | 1974.18 |
| Daily Fibonacci 61.8% | 1977.40 |
| Daily Pivot Point S1 | 1966.36 |
| Daily Pivot Point S2 | 1960.81 |
| Daily Pivot Point S3 | 1952.68 |
| Daily Pivot Point R1 | 1980.04 |
| Daily Pivot Point R2 | 1988.17 |
| Daily Pivot Point R3 | 1993.72 |
[/s2If]
Nehcap Expert Advisor
The NEHCAP MT4 EA is high quality professional trading system geared to generate returns without using GRID or martingales. Each trade has strict risk per trade parameter. The pairs under management include EURUSD, GBPUSD, AUDCAD, AUDNZD,GBPAUD, EURAUD, EURCAD, CHFJPY and many more.
The system is trading live: LIVE ACCOUNT TRACKING
You can run it free. Apply for a free trial and track our account. Buy the system or use profit share mechanism to generate returns on your MT4.
Join Our Telegram Group
")


