#XAUUSD @ 1,967.52 Gold price dips slightly as uncertainty around US debt-ceiling discussions causes US Treasury bond yields to rise, negatively impacting ’s recovery. (Pivot Orderbook analysis)
…
This is a premium post.
[s2If !current_user_can(access_s2member_level4)]Please register for FREE REGISTER to read full post below containing analysis. In case of any error or you think you are not able to read the full post below, please email us at support#nehcap.com [lwa][/s2If] [s2If current_user_can(access_s2member_level1)]
- Gold price dips slightly as uncertainty around US debt-ceiling discussions causes US Treasury bond yields to rise, negatively impacting XAU/USD’s recovery.
- Despite productive talks between President Biden and House Speaker Kevin McCarthy, an agreement on raising the debt ceiling is yet to be reached.
- US is set to run out of cash by June 1, according to Treasury Secretary Yellen.
The pair currently trades last at 1967.52.
The previous day high was 1982.63 while the previous day low was 1968.95. The daily 38.2% Fib levels comes at 1974.18, expected to provide resistance. Similarly, the daily 61.8% fib level is at 1977.4, expected to provide resistance.
Gold price is trimming some of its earlier losses, though stills trading negative in the day, down 0.06%, as US Treasury bond yields rise due to uncertainty around US debt-ceiling discussions. Hence, US Treasury bond yields rise, underpinning the US Dollar (USD), a headwind for XAU/USD’s prices. At the time of writing, the XAU/USD is trading at $1968.28, below its opening price.
Wall Street portrays a sour sentiment, with equities trading lower. The economic data revealed in the United States (US) is overshadowed by discussions about raising the debt ceiling in the US. Although US President Joe Biden and US House Speaker Kevin McCarthy called Monday’s talks productive, an agreement remains far from being done. In the meantime, US Treasury Secretary Janet Yellen continued to pressure that the US will run out of cash by June 1.
Given the backdrop, US Treasury bond yields extended its gains, with the 10-year bond yielding 3.726%, a headwind for XAU/USD’s recovery. Therefore, US real yields, calculated using the nominal yield minus inflation expectations, taken from Treasury Inflation-Protected Securities (TIPS), sit at 1.49%, about to cross above 1.50%.
Data-wise, the US economic agenda features S&P Global PMIs for May on their final readings. The Manufacturing Index plunged to 48.5 below estimates and the prior reading above 50, while the Services Index rose to 55.1. The Composite Index stood at 54.5, dragged by the rise in services.
US New Home Sales rose to a 13-month high, expanded by 4.1% or 683K units in April, the highest figure reported since March 2022, according to the US Commerce Department. Given that housing data from the United States showed signs of a recovery, it should be interesting to hear from US Federal Reserve (Fed) officials, who remain split between skipping or lifting rates at the upcoming June meeting.
Recently, Richmond’s Fed Index for Manufacturing and Services readings dropped sharply, with manufacturing at -15 vs. -8 expected. Services improved to -10 from -29 in April.
The US Federal Reserve Open Market Committee (FOMC) May minutes on Wednesday, followed by Initial Jobless Claims, Gross Domestic Product (GDP) on Thursday, and inflation and consumer sentiment on Friday.
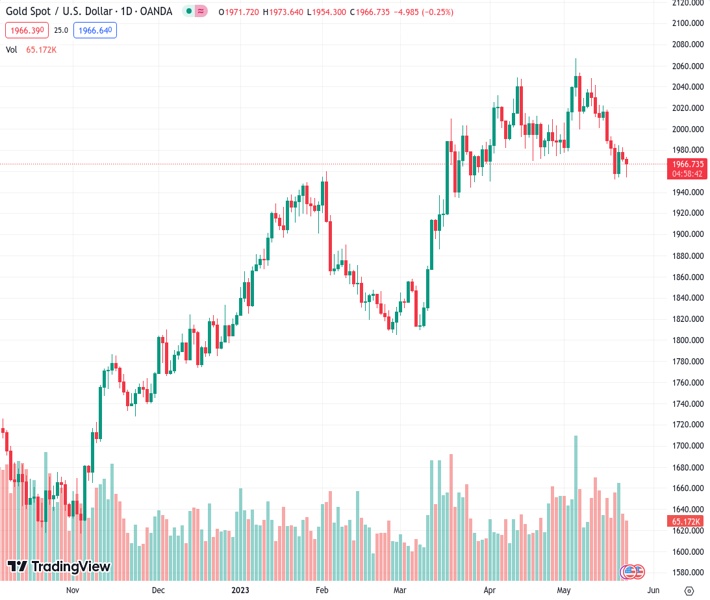
From a daily chart perspective, the XAU/USD is still neutral to upward biased. The yellow metal dip below the 50-day Exponential Moving Average (EMA) at $1976.52, opening the door to register a weekly low of $S1954.37 before finding bids that lifted Gold toward the current spot price. Nevertheless, the Relative Strength Index (RSI) indicator is still in bearish territory, suggesting that sellers remain in charge, so the jump in XAU/USD price, could pave the way for better entry prices. The first support would be the weekly low of $1954.37 before testing $1950, ahead of reaching the 100-day EMA of 1932.97. Conversely, reclaiming the 50-day EMA will expose the 20-day EMA At $1993.31 before reaching $2000.
Technical Levels: Supports and Resistances
XAUUSD currently trading at 1967.05 at the time of writing. Pair opened at 1971.9 and is trading with a change of -0.25 % .
| Overview | Overview.1 | |
|---|---|---|
| 0 | Today last price | 1967.05 |
| 1 | Today Daily Change | -4.85 |
| 2 | Today Daily Change % | -0.25 |
| 3 | Today daily open | 1971.90 |
The pair is trading below its 20 Daily moving average @ 2003.78, below its 50 Daily moving average @ 1989.73 , above its 100 Daily moving average @ 1930.4 and above its 200 Daily moving average @ 1826.71
| Trends | Trends.1 | |
|---|---|---|
| 0 | Daily SMA20 | 2003.78 |
| 1 | Daily SMA50 | 1989.73 |
| 2 | Daily SMA100 | 1930.40 |
| 3 | Daily SMA200 | 1826.71 |
The previous day high was 1982.63 while the previous day low was 1968.95. The daily 38.2% Fib levels comes at 1974.18, expected to provide resistance. Similarly, the daily 61.8% fib level is at 1977.4, expected to provide resistance.
Note the levels of interest below:
- Pivot support is noted at 1966.36, 1960.81, 1952.68
- Pivot resistance is noted at 1980.04, 1988.17, 1993.72
| Levels | Levels.1 |
|---|---|
| Previous Daily High | 1982.63 |
| Previous Daily Low | 1968.95 |
| Previous Weekly High | 2022.18 |
| Previous Weekly Low | 1952.01 |
| Previous Monthly High | 2048.75 |
| Previous Monthly Low | 1949.83 |
| Daily Fibonacci 38.2% | 1974.18 |
| Daily Fibonacci 61.8% | 1977.40 |
| Daily Pivot Point S1 | 1966.36 |
| Daily Pivot Point S2 | 1960.81 |
| Daily Pivot Point S3 | 1952.68 |
| Daily Pivot Point R1 | 1980.04 |
| Daily Pivot Point R2 | 1988.17 |
| Daily Pivot Point R3 | 1993.72 |
[/s2If]
Nehcap Expert Advisor
The NEHCAP MT4 EA is high quality professional trading system geared to generate returns without using GRID or martingales. Each trade has strict risk per trade parameter. The pairs under management include EURUSD, GBPUSD, AUDCAD, AUDNZD,GBPAUD, EURAUD, EURCAD, CHFJPY and many more.
The system is trading live: LIVE ACCOUNT TRACKING
You can run it free. Apply for a free trial and track our account. Buy the system or use profit share mechanism to generate returns on your MT4.
Join Our Telegram Group
")


