#XAUUSD @ 1,961.06 Gold price takes offers to extend week-start retreat towards seven-week low marked the last Thursday., @nehcap view: Further downside expected (Pivot Orderbook analysis)
…
This is a premium post.
[s2If !current_user_can(access_s2member_level4)]Please register for FREE REGISTER to read full post below containing analysis. In case of any error or you think you are not able to read the full post below, please email us at support#nehcap.com [lwa][/s2If] [s2If current_user_can(access_s2member_level1)]
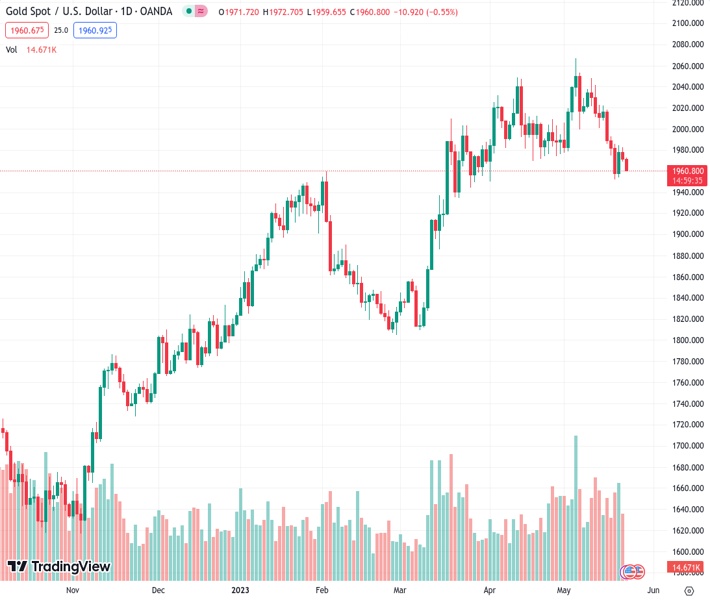
- Gold price takes offers to extend week-start retreat towards seven-week low marked the last Thursday.
- US Dollar ignores sluggish yields, no deal on debt ceiling.
- Hopes that US policymakers will be able to avoid default, hawkish Fed talks underpin US Dollar Index, weigh on XAU/USD.
- Monthly PMIs can entertain Gold traders but major attention will be on the risk catalysts.
The pair currently trades last at 1961.06.
The previous day high was 1982.63 while the previous day low was 1968.95. The daily 38.2% Fib levels comes at 1974.18, expected to provide resistance. Similarly, the daily 61.8% fib level is at 1977.4, expected to provide resistance.
Gold Price (XAU/USD) remains on the back foot around the intraday low of near $1,961 as it drops for the second consecutive day while reversing Friday’s corrective bounce amid early Tuesday in Europe. In doing so, the precious metal bears the burden of the firmer US Dollar ahead of the first readings of Purchasing Managers Indexes (PMI) for May from the leading economies including the US.
That said, US Dollar Index (DXY) grinds higher around 103.30 during the two-day uptrend even as US President Joe Biden and House Speaker Kevin McCarthy failed to offer a deal to avoid the debt ceiling expiry during the latest negotiations. The reason for the greenback’s run-up could be linked to the policymakers’ optimism of reaching an agreement to avoid the US default. “I just concluded a productive meeting with Speaker McCarthy about the need to prevent default,” said US President Biden per the White House announcements shared by Reuters late Monday. On the other hand, US House Speaker McCarthy said that meeting with Biden was productive but no debt ceiling deal.
Additionally, the recent run-up in the odds favoring the Federal Reserve’s (Fed) 0.25% rate hike in June, as well as no rate cuts in 2023, also underpin the US Dollar’s latest run-up, which in turn exerts downside pressure on the Gold price.
It’s worth noting that the fears of the US-China tension and doubts about China’s economic transition add a burden to the XAU/USD. China is one of the world’s largest Gold consumers and hence any negatives for the dragon nation can weigh on the bullion price.
Amid these plays, S&P500 Futures remain mildly bid near 4,220, up for the second consecutive day as it reverses Friday’s pullback from a nine-month high. With the upbeat US stock Futures, as well as the mildly positive performance of Wall Street, the benchmark 10-year and two-year US Treasury bond yields pause a five-day uptrend at the highest levels in two months.
Given the cautious optimism in the market, as well as the firmer US Dollar, the Gold price may witness further downside. However, the monthly PMIs and the US debt ceiling negotiations, as well as the Fed talks, should support the bearish bias.
A clear downside break of a three-day-old ascending support line, now immediate resistance near $1,965, suggests further downside of the Gold price. Adding strength to the downside bias are the bearish MACD signals. However, the monthly low of around $1,950 may prod the bears as RSI appears oversold.
In a case where the Gold price remains bearish past $1,950, the late March swing low near $1,935 may lure the XAU/USD sellers.
Meanwhile, an upside break of the immediate support-turned-resistance line of near $1,965 isn’t an open ticket for the Gold buyers as the 100-HMA hurdle of near $1,974 and a downward-sloping resistance line from May 11, close to $1,977 at the latest, can challenge the XAU/USD upside.
Following that, a three-week-old descending resistance line near $1,989 will act as the last defense of the Gold Bears.
Overall, the Gold price is likely to witness further downside but the road towards the $1,900 threshold appears long and bumpy.
Trend: Further downside expected
Technical Levels: Supports and Resistances
XAUUSD currently trading at 1961.37 at the time of writing. Pair opened at 1971.9 and is trading with a change of -0.53% % .
| Overview | Overview.1 | |
|---|---|---|
| 0 | Today last price | 1961.37 |
| 1 | Today Daily Change | -10.53 |
| 2 | Today Daily Change % | -0.53% |
| 3 | Today daily open | 1971.9 |
The pair is trading below its 20 Daily moving average @ 2003.78, below its 50 Daily moving average @ 1989.73 , above its 100 Daily moving average @ 1930.4 and above its 200 Daily moving average @ 1826.71
| Trends | Trends.1 | |
|---|---|---|
| 0 | Daily SMA20 | 2003.78 |
| 1 | Daily SMA50 | 1989.73 |
| 2 | Daily SMA100 | 1930.40 |
| 3 | Daily SMA200 | 1826.71 |
The previous day high was 1982.63 while the previous day low was 1968.95. The daily 38.2% Fib levels comes at 1974.18, expected to provide resistance. Similarly, the daily 61.8% fib level is at 1977.4, expected to provide resistance.
Note the levels of interest below:
- Pivot support is noted at 1966.36, 1960.81, 1952.68
- Pivot resistance is noted at 1980.04, 1988.17, 1993.72
| Levels | Levels.1 |
|---|---|
| Previous Daily High | 1982.63 |
| Previous Daily Low | 1968.95 |
| Previous Weekly High | 2022.18 |
| Previous Weekly Low | 1952.01 |
| Previous Monthly High | 2048.75 |
| Previous Monthly Low | 1949.83 |
| Daily Fibonacci 38.2% | 1974.18 |
| Daily Fibonacci 61.8% | 1977.40 |
| Daily Pivot Point S1 | 1966.36 |
| Daily Pivot Point S2 | 1960.81 |
| Daily Pivot Point S3 | 1952.68 |
| Daily Pivot Point R1 | 1980.04 |
| Daily Pivot Point R2 | 1988.17 |
| Daily Pivot Point R3 | 1993.72 |
[/s2If]
Nehcap Expert Advisor
The NEHCAP MT4 EA is high quality professional trading system geared to generate returns without using GRID or martingales. Each trade has strict risk per trade parameter. The pairs under management include EURUSD, GBPUSD, AUDCAD, AUDNZD,GBPAUD, EURAUD, EURCAD, CHFJPY and many more.
The system is trading live: LIVE ACCOUNT TRACKING
You can run it free. Apply for a free trial and track our account. Buy the system or use profit share mechanism to generate returns on your MT4.
Join Our Telegram Group
")


