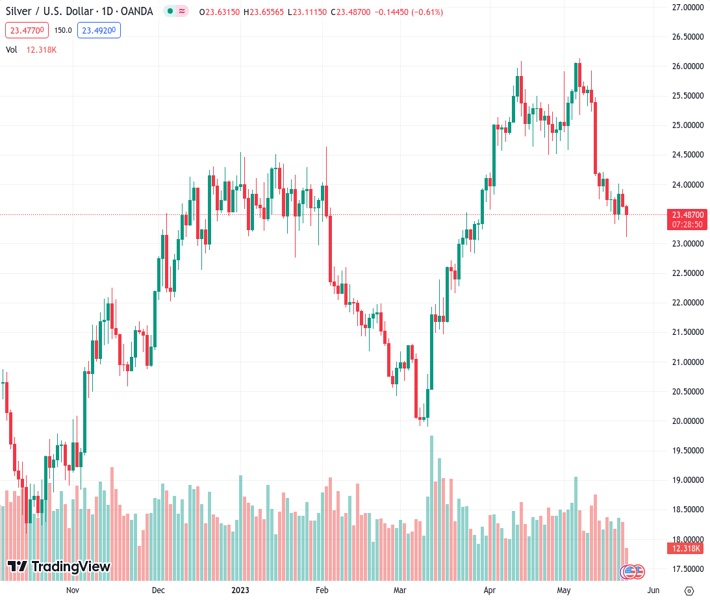
#XAGUSD @ 23.473 Silver breaks through the 100-day SMA support and drops to a nearly two-month low. (Pivot Orderbook analysis)
…
This is a premium post.
[s2If !current_user_can(access_s2member_level4)]Please register for FREE REGISTER to read full post below containing analysis. In case of any error or you think you are not able to read the full post below, please email us at support#nehcap.com [lwa][/s2If] [s2If current_user_can(access_s2member_level1)]
- Silver breaks through the 100-day SMA support and drops to a nearly two-month low.
- The technical setup favours bearish traders and supports prospects for further losses.
- A sustained strength beyond the $24.00 mark is needed to negate the bearish outlook.
The pair currently trades last at 23.473.
The previous day high was 23.92 while the previous day low was 23.61. The daily 38.2% Fib levels comes at 23.73, expected to provide resistance. Similarly, the daily 61.8% fib level is at 23.8, expected to provide resistance.
Silver continues losing ground for the second successive day on Tuesday and confirms a fresh bearish breakdown through the 100-day Simple Moving Average (SMA). The white metal maintains its heavily offered tone through the early North American session and currently trades around the $23.25-$23.30 region, just above a nearly two-month low.
The recent repeated failures near the $24.00 round-figure mark and the subsequent slide below a technically significant moving average could be seen as a fresh trigger for bearish traders. Moreover, oscillators on the daily chart are holding deep in the negative territory and are still far from being in the oversold zone. This, in turn, supports prospects for an extension of the recent retracement slide from over a one-year top, around the $26.15 region touched earlier this month.
Some follow-through selling below the $23.00 mark, which coincides with the 50% Fibonacci retracement level of the March-May rally, will reaffirm the negative outlook. The XAG/USD might then accelerate the fall towards intermediate support near the $22.60-$22.55 region before eventually dropping to the 61.8% Fibo. level, around the $22.25-$22.20 region. This is followed by the $22.00 mark, which if broken decisively will set the stage for a further near-term depreciating move.
On the flip side, attempted recovery back above the 100-day SMA, currently around the $23.35 region, is more likely to attract fresh sellers near the 38.2% Fibo. level, around the $23.75 area. This, in turn, should cap the upside for the XAG/USD near the $24.00 round-figure mark. Some follow-through buying beyond the $24.20-$24.25 region, however, might negate the near-term bearish outlook and prompt an aggressive short-covering rally towards the $25.00 psychological mark.
Technical Levels: Supports and Resistances
XAGUSD currently trading at 23.35 at the time of writing. Pair opened at 23.64 and is trading with a change of -1.23 % .
| Overview | Overview.1 | |
|---|---|---|
| 0 | Today last price | 23.35 |
| 1 | Today Daily Change | -0.29 |
| 2 | Today Daily Change % | -1.23 |
| 3 | Today daily open | 23.64 |
The pair is trading below its 20 Daily moving average @ 24.75, below its 50 Daily moving average @ 24.26 , below its 100 Daily moving average @ 23.39 and above its 200 Daily moving average @ 21.95
| Trends | Trends.1 | |
|---|---|---|
| 0 | Daily SMA20 | 24.75 |
| 1 | Daily SMA50 | 24.26 |
| 2 | Daily SMA100 | 23.39 |
| 3 | Daily SMA200 | 21.95 |
The previous day high was 23.92 while the previous day low was 23.61. The daily 38.2% Fib levels comes at 23.73, expected to provide resistance. Similarly, the daily 61.8% fib level is at 23.8, expected to provide resistance.
Note the levels of interest below:
- Pivot support is noted at 23.52, 23.41, 23.21
- Pivot resistance is noted at 23.84, 24.04, 24.15
| Levels | Levels.1 |
|---|---|
| Previous Daily High | 23.92 |
| Previous Daily Low | 23.61 |
| Previous Weekly High | 24.21 |
| Previous Weekly Low | 23.33 |
| Previous Monthly High | 26.09 |
| Previous Monthly Low | 23.57 |
| Daily Fibonacci 38.2% | 23.73 |
| Daily Fibonacci 61.8% | 23.80 |
| Daily Pivot Point S1 | 23.52 |
| Daily Pivot Point S2 | 23.41 |
| Daily Pivot Point S3 | 23.21 |
| Daily Pivot Point R1 | 23.84 |
| Daily Pivot Point R2 | 24.04 |
| Daily Pivot Point R3 | 24.15 |
[/s2If]
Nehcap Expert Advisor
The NEHCAP MT4 EA is high quality professional trading system geared to generate returns without using GRID or martingales. Each trade has strict risk per trade parameter. The pairs under management include EURUSD, GBPUSD, AUDCAD, AUDNZD,GBPAUD, EURAUD, EURCAD, CHFJPY and many more.
The system is trading live: LIVE ACCOUNT TRACKING
You can run it free. Apply for a free trial and track our account. Buy the system or use profit share mechanism to generate returns on your MT4.
Join Our Telegram Group
")


