#USDCHF @ 0.90192 pair surges past the 0.9000 figure, aiming for a 50-day EMA test at 0.9025 after printing a bullish hammer on the daily chart, turning bias to neutral upwards. (Pivot Orderbook analysis)
…
This is a premium post.
[s2If !current_user_can(access_s2member_level4)]Please register for FREE REGISTER to read full post below containing analysis. In case of any error or you think you are not able to read the full post below, please email us at support#nehcap.com [lwa][/s2If] [s2If current_user_can(access_s2member_level1)]
- USD/CHF pair surges past the 0.9000 figure, aiming for a 50-day EMA test at 0.9025 after printing a bullish hammer on the daily chart, turning bias to neutral upwards.
- USD/CHF rally could challenge the 100-day EMA at 0.9137 if the 50-day EMA is breached, setting sights on the April 3 daily high of 0.9196.
- Despite a neutral 3-day RoC, RSI indicates a bullish turn, suggesting USD/CHF bulls are gathering momentum.
The pair currently trades last at 0.90192.
The previous day high was 0.8997 while the previous day low was 0.8941. The daily 38.2% Fib levels comes at 0.8963, expected to provide support. Similarly, the daily 61.8% fib level is at 0.8976, expected to provide support.
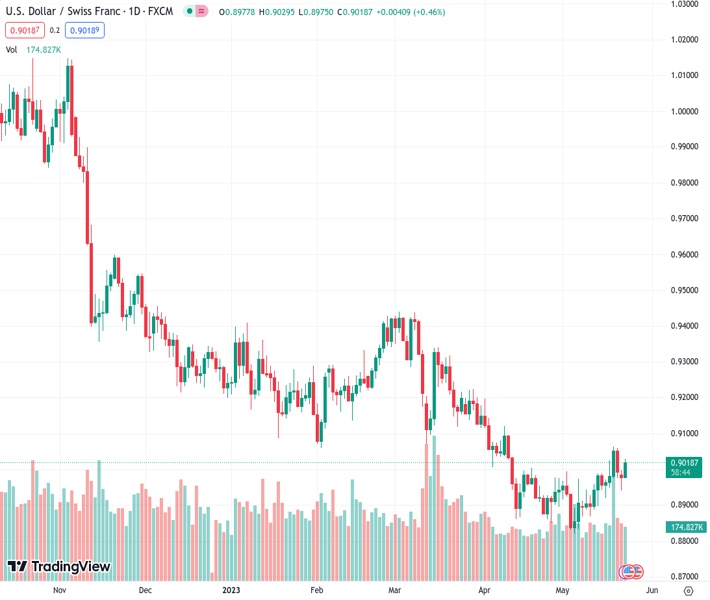
USD/CHF climbs above the 0.9000 figure, eyeing a 50-day Exponential Moving Average (EMA) test at 0.9025 after printing a bullish hammer in the daily chart. The USD/CHF is trading at 0.9015, after hitting a daily low of 0.8975, trades above its opening price by 0.42%.
The USD/CHF pair is neutral to downward biased unless it claims the 50-day EMA at 0.9025, which would turn the bias to neutral upwards. It should be said the USD/CHF printed a new daily high, above the May 2 high of 0.8995, opening the door for further upside. If USD/CHF cracks the 50-day EMA, the pair will test last week’s high of 0.9063 before rallying toward the 0.9100 mark. That would further cement a bullish bias, with the USD/CHF about to challenge the 100-day EMA at 0.9137, on its way to the April 3 daily high of 0.9196.
Notably, the Relative Strength Index (RSI) indicator turned bullish and just bounced off the 50-midline, a sign of USD/CHF bulls gathering momentum; while the 3-day Rate of Change (RoC) remains neutrally biased.
Therefore, the USD/CHF trend would likely continue upward. On the downside, the USD/CHF’s first support would be the 0.9000 figure, which, once cleared, the pair would dip to the 20-day EMA At 0.8968.
Technical Levels: Supports and Resistances
USDCHF currently trading at 0.9019 at the time of writing. Pair opened at 0.8979 and is trading with a change of 0.45 % .
| Overview | Overview.1 | |
|---|---|---|
| 0 | Today last price | 0.9019 |
| 1 | Today Daily Change | 0.0040 |
| 2 | Today Daily Change % | 0.4500 |
| 3 | Today daily open | 0.8979 |
The pair is trading above its 20 Daily moving average @ 0.8938, below its 50 Daily moving average @ 0.9032 , below its 100 Daily moving average @ 0.9148 and below its 200 Daily moving average @ 0.94
| Trends | Trends.1 | |
|---|---|---|
| 0 | Daily SMA20 | 0.8938 |
| 1 | Daily SMA50 | 0.9032 |
| 2 | Daily SMA100 | 0.9148 |
| 3 | Daily SMA200 | 0.9400 |
The previous day high was 0.8997 while the previous day low was 0.8941. The daily 38.2% Fib levels comes at 0.8963, expected to provide support. Similarly, the daily 61.8% fib level is at 0.8976, expected to provide support.
Note the levels of interest below:
- Pivot support is noted at 0.8947, 0.8916, 0.8891
- Pivot resistance is noted at 0.9004, 0.9029, 0.906
| Levels | Levels.1 |
|---|---|
| Previous Daily High | 0.8997 |
| Previous Daily Low | 0.8941 |
| Previous Weekly High | 0.9063 |
| Previous Weekly Low | 0.8920 |
| Previous Monthly High | 0.9198 |
| Previous Monthly Low | 0.8852 |
| Daily Fibonacci 38.2% | 0.8963 |
| Daily Fibonacci 61.8% | 0.8976 |
| Daily Pivot Point S1 | 0.8947 |
| Daily Pivot Point S2 | 0.8916 |
| Daily Pivot Point S3 | 0.8891 |
| Daily Pivot Point R1 | 0.9004 |
| Daily Pivot Point R2 | 0.9029 |
| Daily Pivot Point R3 | 0.9060 |
[/s2If]
Nehcap Expert Advisor
The NEHCAP MT4 EA is high quality professional trading system geared to generate returns without using GRID or martingales. Each trade has strict risk per trade parameter. The pairs under management include EURUSD, GBPUSD, AUDCAD, AUDNZD,GBPAUD, EURAUD, EURCAD, CHFJPY and many more.
The system is trading live: LIVE ACCOUNT TRACKING
You can run it free. Apply for a free trial and track our account. Buy the system or use profit share mechanism to generate returns on your MT4.
Join Our Telegram Group
")


