Oil price continues sluggish recovery on budding optimism US lawmakers will reach agreement to raise US debt ceiling.
…
This is a premium post.
[s2If !current_user_can(access_s2member_level4)]Please register for FREE REGISTER to read full post below containing analysis. In case of any error or you think you are not able to read the full post below, please email us at support#nehcap.com [lwa][/s2If] [s2If current_user_can(access_s2member_level1)]
- Oil price continues sluggish recovery on budding optimism US lawmakers will reach agreement to raise US debt ceiling.
- A bullish triangle price pattern forms on the 4-hour chart increasing the evidence the bearish trend may be reversing.
- API inventory data to be released later on Tuesday could inject some volatility into Crude Oil price action.
Oil price trades marginally higher on Tuesday, continuing its recovery from the poor open at the start of the week. Financial markets in general suffer a lack of volatility due to uncertainty over the United States debt ceiling. In the event of a default, US demand would plummet, resulting in lower Oil prices. Optimism after talks on Monday raises hopes, with history showing a last-minute deal is the norm.
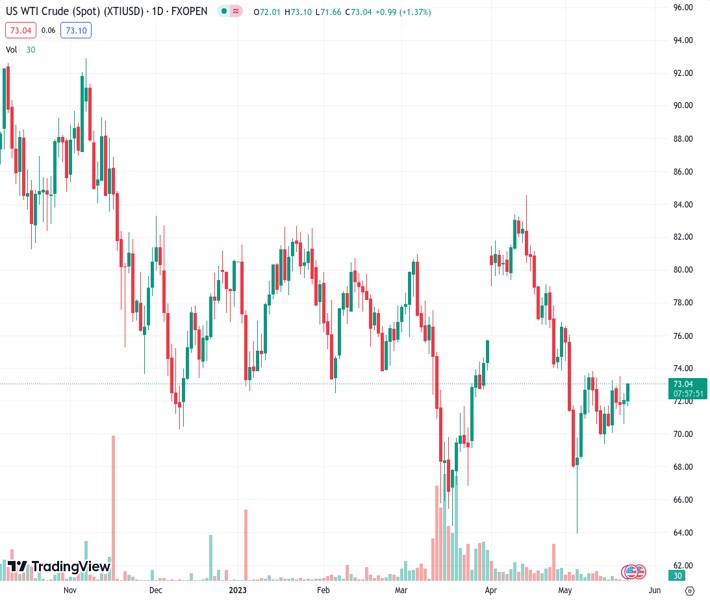
At the time of writing, WTI Oil is trading in the mid $72s and Brent Crude Oil in the lower $76s. A bullish right-angled triangle has formed on the 4-hour chart, challenging the overall bear trend.
WTI Oil is in a long-term downtrend, making successive lower lows. Given the old adage that the trend is your friend, this favors short positions over long positions. WTI Oil is trading below all the major daily Simple Moving Averages (SMA) and all the weekly SMAs except the 200-week which is at $66.89.
WTI US Oil: Daily Chart
A break below the year-to-date (YTD) lows of $64.31, however, would be required to re-ignite the downtrend, with the next target at around $62.00 where trough lows from 2021 will come into play, followed by support at $57.50.
Despite the bearish trend dominating, there are growing signs pointing to a possible conclusion and reversal. The mild bullish convergence between price and the Relative Strength Index (RSI) at the March and May 2023 lows – with price making a lower low in May that is not matched by a lower low in RSI – is a sign that bearish pressure is easing.
The long hammer Japanese candlestick pattern that formed at the May 4 (and year-to-date) lows is a sign that it could be a key strategic bottom.
Further, a right-angled triangle can also be seen forming on the 4-hour chart below, which because of its shape is biased to breakout higher.
WTI US Oil: 4-hour Chart
The triangle could have formed after price recovered from the May 4 YTD lows. The initial rebound off the May 4 lows could be seen as a Wave A, with B descending between May 8-15. Wave C then probably rose in the week that followed before the market turned again at the start of this week, in what might be a Wave D. The recovery currently underway could be Wave E. Since most triangles are only composed of five waves this would be the last wave before the pattern breaks out.
There is a chance the triangle might break in either direction, but it is biased to break higher. This is because the top border is flat (it is right angled). Such a move would see price rise in a volatile rally to a potential target of $79.75, calculated by taking 61.8% the height of the triangle and extrapolating it higher. This is also at the level of the 200-day SMA which is likely to provide tough resistance to any further gains.
Such a break would probably mean price breaking above the $76.85 lower high of April 28, thereby, bringing the dominant bear trend into doubt.
False breaks are common with this pattern, however, and traders should ideally wait for a ‘decisive’ break. Such a break is characterized by a longer-than-average bullish green bar which pierces completely through the upper borderline of the triangle and closes near the 4-hour period’s highs, or alternatively three green bars in a row that also pierce above the borderline.
Given the downtrend is dominant, however, there is still also a possibility WTI Oil price could break lower, with a decisive break below the lower border, likewise required, and a target at $67.27. This is just above where the 200-week SMA is located and likely to offer support. Traders might even wish to wait for a break below the lows of Wave B at $69.40 for added confirmation.
[/s2If]
Nehcap Expert Advisor
The NEHCAP MT4 EA is high quality professional trading system geared to generate returns without using GRID or martingales. Each trade has strict risk per trade parameter. The pairs under management include EURUSD, GBPUSD, AUDCAD, AUDNZD,GBPAUD, EURAUD, EURCAD, CHFJPY and many more.
The system is trading live: LIVE ACCOUNT TRACKING
You can run it free. Apply for a free trial and track our account. Buy the system or use profit share mechanism to generate returns on your MT4.
Join Our Telegram Group
")


