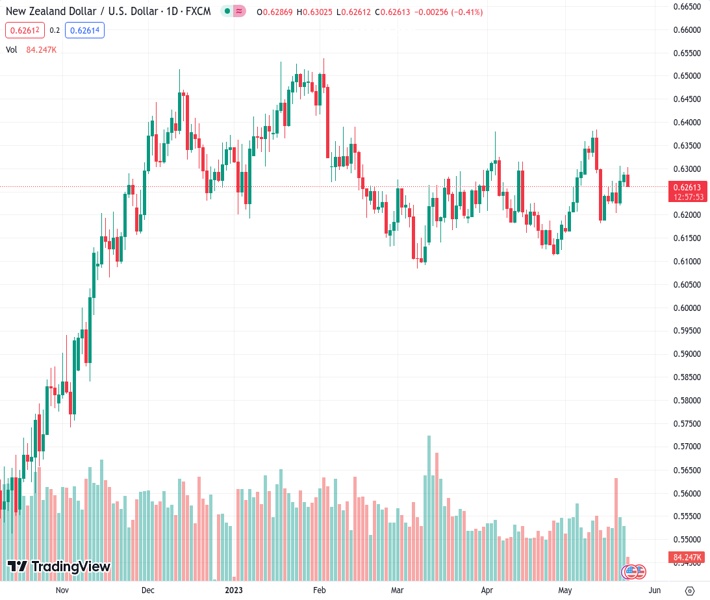
#NZDUSD @ 0.62645 comes under some selling pressure after facing rejection near the 0.6300 mark on Tuesday. (Pivot Orderbook analysis)
…
This is a premium post.
[s2If !current_user_can(access_s2member_level4)]Please register for FREE REGISTER to read full post below containing analysis. In case of any error or you think you are not able to read the full post below, please email us at support#nehcap.com [lwa][/s2If] [s2If current_user_can(access_s2member_level1)]
- NZD/USD comes under some selling pressure after facing rejection near the 0.6300 mark on Tuesday.
- The USD stands tall near a two-month high and turns out to be a key factor dragging the pair lower.
- Traders now look to the US PMIs for some impetus ahead of the RBNZ policy meeting on Wednesday.
The pair currently trades last at 0.62645.
The previous day high was 0.6293 while the previous day low was 0.6262. The daily 38.2% Fib levels comes at 0.6281, expected to provide resistance. Similarly, the daily 61.8% fib level is at 0.6274, expected to provide resistance.
The NZD/USD pair continues with its struggle to find acceptance or build on its modest intraday gains beyond the 0.6300 mark and meets with a fresh supply on Tuesday. The selling picks up pace during the early European session and drags spot prices to a fresh daily low, around the 0.6265 region in the last hour.
A combination of factors push the US Dollar (USD) higher for the second straight day, back closer to a two-month high touched last Friday, which, in turn, is seen exerting some downward pressure on the NZD/USD pair. Despite the less hawkish remarks by Federal Reserve (Fed) Chair Jerome Powell, investors seem convinced that the US central bank is likely to continue hiking interest rates. The bets were lifted by the overnight comments by a slew of influential FOMC members, indicating that the US central bank will keep interest rates higher for longer. This, along with hopes that US politicians can come together on a debt ceiling deal, keeps the US Treasury bond yields elevated and continues to benefit the Greenback.
In fact, US President Joe Biden and House Speaker Kevin McCarthy ended discussions on Monday with no agreement on how to raise the US government’s $31.4 trillion debt ceiling and will keep talking just 10 days before a possible default. This, in turn, allowed the yield on the benchmark 10-year US government bond to rise for a seventh straight day on Monday and register its longest winning streak since April 2022. Apart from this, worries over slowing global growth, particularly in China, further benefit the safe-haven buck and weigh on antipodean currencies, including the New Zealand Dollar (NZD). It is worth recalling that data released from China last week showed that the world’s second-largest economy underperformed in April.
The NZD/USD pair, however, finds some support near the 200-hour Simple Moving Average (SMA), at least for the time being, as traders seem reluctant to place aggressive bets ahead of the Reserve Bank of New Zealand (RBNZ) meeting on Wednesday. The recent survey showed that inflation expectations for the first quarter eased to 2.79% from 3.30% and forced investors to scale back their bets for further rate hikes. This might have set the stage for a dovish shift and favour bearish traders. Heading into the key central bank event risk, traders on Tuesday will take cues from the flash US PMI prints.
The US economic docket also features the release of New Home Sales data and the Richmond Manufacturing Index, due later during the early North American session. This, along with the US bond yields, the US debt ceiling talks and the broader risk sentiment, might influence the USD price dynamics and provide some impetus to the NZD/USD pair.
Technical Levels: Supports and Resistances
NZDUSD currently trading at 0.6268 at the time of writing. Pair opened at 0.6287 and is trading with a change of -0.3 % .
| Overview | Overview.1 | |
|---|---|---|
| 0 | Today last price | 0.6268 |
| 1 | Today Daily Change | -0.0019 |
| 2 | Today Daily Change % | -0.3000 |
| 3 | Today daily open | 0.6287 |
The pair is trading above its 20 Daily moving average @ 0.6232, above its 50 Daily moving average @ 0.623 , below its 100 Daily moving average @ 0.6273 and above its 200 Daily moving average @ 0.6156
| Trends | Trends.1 | |
|---|---|---|
| 0 | Daily SMA20 | 0.6232 |
| 1 | Daily SMA50 | 0.6230 |
| 2 | Daily SMA100 | 0.6273 |
| 3 | Daily SMA200 | 0.6156 |
The previous day high was 0.6293 while the previous day low was 0.6262. The daily 38.2% Fib levels comes at 0.6281, expected to provide resistance. Similarly, the daily 61.8% fib level is at 0.6274, expected to provide resistance.
Note the levels of interest below:
- Pivot support is noted at 0.6268, 0.625, 0.6237
- Pivot resistance is noted at 0.6299, 0.6312, 0.633
| Levels | Levels.1 |
|---|---|
| Previous Daily High | 0.6293 |
| Previous Daily Low | 0.6262 |
| Previous Weekly High | 0.6306 |
| Previous Weekly Low | 0.6117 |
| Previous Monthly High | 0.6389 |
| Previous Monthly Low | 0.6111 |
| Daily Fibonacci 38.2% | 0.6281 |
| Daily Fibonacci 61.8% | 0.6274 |
| Daily Pivot Point S1 | 0.6268 |
| Daily Pivot Point S2 | 0.6250 |
| Daily Pivot Point S3 | 0.6237 |
| Daily Pivot Point R1 | 0.6299 |
| Daily Pivot Point R2 | 0.6312 |
| Daily Pivot Point R3 | 0.6330 |
[/s2If]
Nehcap Expert Advisor
The NEHCAP MT4 EA is high quality professional trading system geared to generate returns without using GRID or martingales. Each trade has strict risk per trade parameter. The pairs under management include EURUSD, GBPUSD, AUDCAD, AUDNZD,GBPAUD, EURAUD, EURCAD, CHFJPY and many more.
The system is trading live: LIVE ACCOUNT TRACKING
You can run it free. Apply for a free trial and track our account. Buy the system or use profit share mechanism to generate returns on your MT4.
Join Our Telegram Group
")


