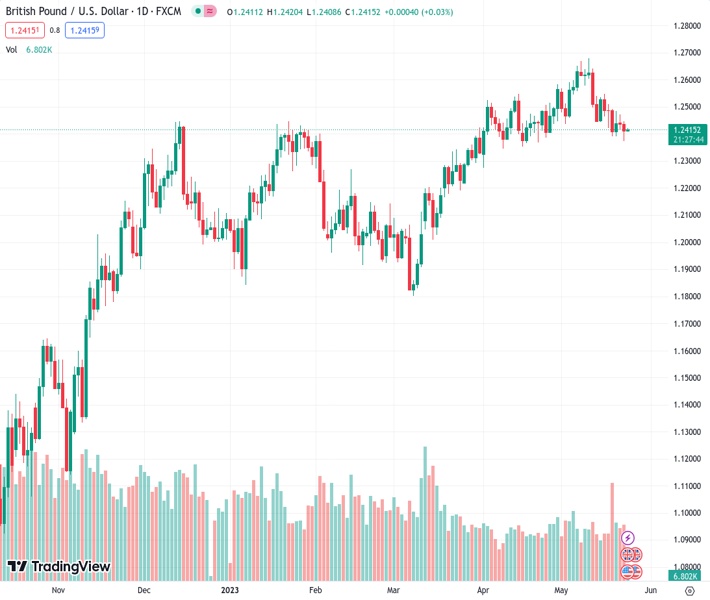
#GBPUSD @ 1.24165 is displaying a sideways auction as the focus has shifted to UK Inflation. (Pivot Orderbook analysis)
…
This is a premium post.
[s2If !current_user_can(access_s2member_level4)]Please register for FREE REGISTER to read full post below containing analysis. In case of any error or you think you are not able to read the full post below, please email us at support#nehcap.com [lwa][/s2If] [s2If current_user_can(access_s2member_level1)]
- GBP/USD is displaying a sideways auction as the focus has shifted to UK Inflation.
- BoE Bailey reiterated that they must use the tool of interest rate rises carefully.
- GBP/USD is auctioning in a Falling Wedge pattern in which each pullback is considered as a selling opportunity.
The pair currently trades last at 1.24165.
The previous day high was 1.2472 while the previous day low was 1.2414. The daily 38.2% Fib levels comes at 1.2436, expected to provide resistance. Similarly, the daily 61.8% fib level is at 1.245, expected to provide resistance.
The GBP/USD pair is displaying a back-and-forth action around 1.2420 in the early Tokyo session. Earlier, the Cable showed significant recovery after defending the downside near 1.2380. A power-pack action is anticipated from the Pound Sterling ahead of the United Kingdom’s Consumer Price Index (CPI) data (April).
Headline inflation is seen softening sharply to 8.2% from the former release of 10.1%. The core CPI is expected to remain steady at 6.2%. On Tuesday, Bank of England (BoE) Governor Andrew Bailey said “I think we are nearer to the peak than we were” and reiterated that they must use the tool of interest rate rises carefully.
The US Dollar Index (DXY) is looking to surpass the crucial resistance of 103.62 amid US debt-ceiling issues. International Monetary Fund (IMF) Managing Director Kristalina Georgieva cited on Tuesday that “A lack of solution would have a detrimental impact on the US and world economy,” “Hopefully we won’t have to wait to the 11th hour for a solution on the US debt-ceiling.”
GBP/USD is auctioning in a Falling Wedge chart pattern on a two-hour scale in which each pullback is considered a selling opportunity by the market participants. Also, the chances of a bullish reversal remain higher. The 50-period Exponential Moving Average (EMA) at 1.2440 is acting as a barrier for the Pound Sterling bulls.
Meanwhile, a 40.00-60.00 range oscillation by the Relative Strength Index (RSI) (14) will get a decisive move after the release of the UK Inflation.
Should the asset decline below May 19 low at 1.2390, US Dollar bulls will get strengthened further and will drag the Cable toward April 10 low at 1.2344 followed by April 03 low at 1.2275.
On the flip side, a recovery move above May 09 high at 1.2640 will drive the major toward the round-level resistance at 1.2700 and 26 April 2022 high at 1.2772.
Technical Levels: Supports and Resistances
GBPUSD currently trading at 1.2419 at the time of writing. Pair opened at 1.2437 and is trading with a change of -0.14 % .
| Overview | Overview.1 | |
|---|---|---|
| 0 | Today last price | 1.2419 |
| 1 | Today Daily Change | -0.0018 |
| 2 | Today Daily Change % | -0.1400 |
| 3 | Today daily open | 1.2437 |
The pair is trading below its 20 Daily moving average @ 1.2515, above its 50 Daily moving average @ 1.2416 , above its 100 Daily moving average @ 1.2274 and above its 200 Daily moving average @ 1.1971
| Trends | Trends.1 | |
|---|---|---|
| 0 | Daily SMA20 | 1.2515 |
| 1 | Daily SMA50 | 1.2416 |
| 2 | Daily SMA100 | 1.2274 |
| 3 | Daily SMA200 | 1.1971 |
The previous day high was 1.2472 while the previous day low was 1.2414. The daily 38.2% Fib levels comes at 1.2436, expected to provide resistance. Similarly, the daily 61.8% fib level is at 1.245, expected to provide resistance.
Note the levels of interest below:
- Pivot support is noted at 1.241, 1.2382, 1.2351
- Pivot resistance is noted at 1.2468, 1.25, 1.2527
| Levels | Levels.1 |
|---|---|
| Previous Daily High | 1.2472 |
| Previous Daily Low | 1.2414 |
| Previous Weekly High | 1.2547 |
| Previous Weekly Low | 1.2392 |
| Previous Monthly High | 1.2584 |
| Previous Monthly Low | 1.2275 |
| Daily Fibonacci 38.2% | 1.2436 |
| Daily Fibonacci 61.8% | 1.2450 |
| Daily Pivot Point S1 | 1.2410 |
| Daily Pivot Point S2 | 1.2382 |
| Daily Pivot Point S3 | 1.2351 |
| Daily Pivot Point R1 | 1.2468 |
| Daily Pivot Point R2 | 1.2500 |
| Daily Pivot Point R3 | 1.2527 |
[/s2If]
Nehcap Expert Advisor
The NEHCAP MT4 EA is high quality professional trading system geared to generate returns without using GRID or martingales. Each trade has strict risk per trade parameter. The pairs under management include EURUSD, GBPUSD, AUDCAD, AUDNZD,GBPAUD, EURAUD, EURCAD, CHFJPY and many more.
The system is trading live: LIVE ACCOUNT TRACKING
You can run it free. Apply for a free trial and track our account. Buy the system or use profit share mechanism to generate returns on your MT4.
Join Our Telegram Group
")


