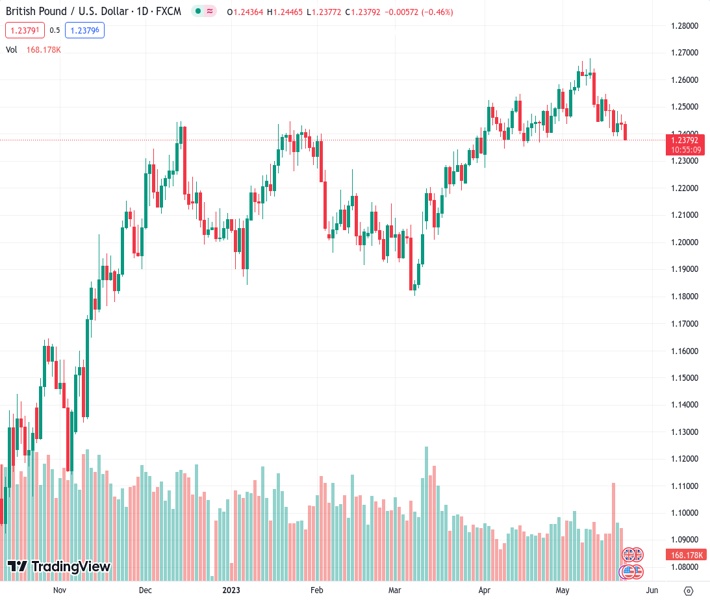
#GBPUSD @ 1.23798 drops to over a one-month low on Tuesday and is pressured by modest USD strength. (Pivot Orderbook analysis)
…
This is a premium post.
[s2If !current_user_can(access_s2member_level4)]Please register for FREE REGISTER to read full post below containing analysis. In case of any error or you think you are not able to read the full post below, please email us at support#nehcap.com [lwa][/s2If] [s2If current_user_can(access_s2member_level1)]
- GBP/USD drops to over a one-month low on Tuesday and is pressured by modest USD strength.
- A combination of factors remains supportive of elevated US bond yields and underpins the USD.
- Bets for fewer BoE rate hikes, weaker UK PMIs weigh on the GBP and contribute to the decline.
The pair currently trades last at 1.23798.
The previous day high was 1.2472 while the previous day low was 1.2414. The daily 38.2% Fib levels comes at 1.2436, expected to provide resistance. Similarly, the daily 61.8% fib level is at 1.245, expected to provide resistance.
The GBP/USD pair comes under some renewed selling pressure on Tuesday and drops to over a one-month low during the first half of the European session. The pair is currently placed just below the 1.2400 round-figure mark, down around 0.35% for the day, confirming a fresh breakdown through the 50-day Simple Moving Average (SMA).
A combination of factors lifts the US Dollar (USD) back closer to its highest level since March 20 touched last Friday, which, in turn, is seen dragging the GBP/USD pair lower. The overnight hawkish remarks by a slew of influential Federal Reserve (Fed) officials reaffirmed expectations that the US central bank will keep interest rates higher for longer. In fact, the markets are now pricing in a small chance of another 25 bps lift-off at the June FOMC meeting. Moreover, investors have been scaling back their bets for interest rate cuts later this year. This, along with hopes that US politicians can come together on a debt ceiling deal, keeps the US Treasury bond yields elevated and continues to benefit the Greenback.
In fact, the yield on the benchmark 10-year US government bond rise for a seventh straight day on Monday and register its longest winning streak since April 2022. Apart from this, worries over slowing global growth, particularly in China, further benefit the safe-haven buck. The British Pound (GBP), on the other hand, is undermined by expectations that fewer rate increases by the Bank of England (BoE) will be needed in the coming months to bring down inflation. The bets were lifted by rather unimpressive UK jobs data released last Tuesday and BoE Governor Andrew Bailey’s comments, saying that inflation has turned the corner and there are some signs that the labour market is loosening a little.
Apart from this, the disappointing release of the flash UK PMI prints for May further contributes to the offered tone around the GBP/USD pair. The S&P Global/CIPS reported this Tuesday that the UK Manufacturing Purchasing Managers’ Index (PMI) fell to 46.9 in May versus 48.0 expected and, April’s final reading of 47.8. Furthermore, the Preliminary UK Services Business Activity Index for May slipped to 55.1, compared with a 55.9 final print for April and 55.5 expected. This, in turn, favours bearish traders and supports prospects for a further intraday depreciating move for the major.
Market participants now look forward to the US economic docket, featuring the flash PMI prints, New Home Sales data and the Richmond Manufacturing Index. due for release later during the early North American session. This, along with the US debt ceiling talks and the US bond yields, will influence the USD price dynamics and provide some impetus to the GBP/USD pair. Apart from this, traders will take cues from the broader risk sentiment to grab short-term opportunities.
Technical Levels: Supports and Resistances
GBPUSD currently trading at 1.2385 at the time of writing. Pair opened at 1.2437 and is trading with a change of -0.42 % .
| Overview | Overview.1 | |
|---|---|---|
| 0 | Today last price | 1.2385 |
| 1 | Today Daily Change | -0.0052 |
| 2 | Today Daily Change % | -0.4200 |
| 3 | Today daily open | 1.2437 |
The pair is trading below its 20 Daily moving average @ 1.2515, below its 50 Daily moving average @ 1.2416 , above its 100 Daily moving average @ 1.2274 and above its 200 Daily moving average @ 1.1971
| Trends | Trends.1 | |
|---|---|---|
| 0 | Daily SMA20 | 1.2515 |
| 1 | Daily SMA50 | 1.2416 |
| 2 | Daily SMA100 | 1.2274 |
| 3 | Daily SMA200 | 1.1971 |
The previous day high was 1.2472 while the previous day low was 1.2414. The daily 38.2% Fib levels comes at 1.2436, expected to provide resistance. Similarly, the daily 61.8% fib level is at 1.245, expected to provide resistance.
Note the levels of interest below:
- Pivot support is noted at 1.241, 1.2382, 1.2351
- Pivot resistance is noted at 1.2468, 1.25, 1.2527
| Levels | Levels.1 |
|---|---|
| Previous Daily High | 1.2472 |
| Previous Daily Low | 1.2414 |
| Previous Weekly High | 1.2547 |
| Previous Weekly Low | 1.2392 |
| Previous Monthly High | 1.2584 |
| Previous Monthly Low | 1.2275 |
| Daily Fibonacci 38.2% | 1.2436 |
| Daily Fibonacci 61.8% | 1.2450 |
| Daily Pivot Point S1 | 1.2410 |
| Daily Pivot Point S2 | 1.2382 |
| Daily Pivot Point S3 | 1.2351 |
| Daily Pivot Point R1 | 1.2468 |
| Daily Pivot Point R2 | 1.2500 |
| Daily Pivot Point R3 | 1.2527 |
[/s2If]
Nehcap Expert Advisor
The NEHCAP MT4 EA is high quality professional trading system geared to generate returns without using GRID or martingales. Each trade has strict risk per trade parameter. The pairs under management include EURUSD, GBPUSD, AUDCAD, AUDNZD,GBPAUD, EURAUD, EURCAD, CHFJPY and many more.
The system is trading live: LIVE ACCOUNT TRACKING
You can run it free. Apply for a free trial and track our account. Buy the system or use profit share mechanism to generate returns on your MT4.
Join Our Telegram Group
")


