#EURJPY @ 149.235 After achieving a weekly high of 150.05, retreats to 149.24 amid souring sentiment. (Pivot Orderbook analysis)
…
This is a premium post.
[s2If !current_user_can(access_s2member_level4)]Please register for FREE REGISTER to read full post below containing analysis. In case of any error or you think you are not able to read the full post below, please email us at support#nehcap.com [lwa][/s2If] [s2If current_user_can(access_s2member_level1)]
- After achieving a weekly high of 150.05, EUR/JPY retreats to 149.24 amid souring sentiment.
- The failure to surpass the 150.00 threshold and harmful Eurozone data create downward pressure.
- Market players eye crucial cues from upcoming ECB speakers and Japanese inflation figures.
The pair currently trades last at 149.235.
The previous day high was 149.93 while the previous day low was 148.84. The daily 38.2% Fib levels comes at 149.51, expected to provide resistance. Similarly, the daily 61.8% fib level is at 149.25, expected to provide resistance.
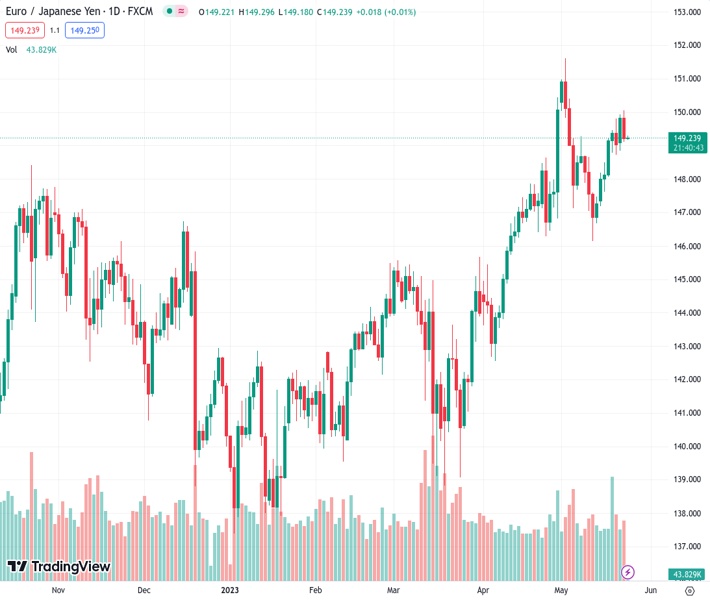
Following Tuesday’s session, EUR/JPY floats at around 149.24, which witnessed the EUR/JPY pair hitting a new weekly high of 150.05, before the cross tumbled as sentiment deteriorated, finishing Tuesday’s session with losses of 0.40%.
The EUR/JPY daily chart suggests the pair remains neutral but slightly downward biased, as it remains below the year-to-date (YTD) high of 151.61. in the last three trading days, the EUR/JPY failed to conquer the 150.00 figure, and bad Eurozone (EU) economic data on Tuesday exposed the pair to selling pressure. That would likely keep the EUR/JPY trapped within the 149.00-150.00 area unless fundamental catalysts like European Central Bank (ECB) speakers or Japanese inflation figures give some cues about the EUR/JPY’s trend direction.
On the upside, the EUR/JPY first resistance is 150.00. A breach of it, and the cross could rally toward 151.00, ahead of the YTD high of 151.61. Conversely, the EUR/JPY first support is 149.00. A successful move below this resistance will pave the way for a pullback toward the 20-day Exponential Moving Average (EMA) at 148.42 before dipping toward the 148.00 figure. The next stop would be the 59-day EMA at 146.85.
The Relative Strength Index (RSI) indicator is stills in bullish territory but turned flat, suggesting that buyers are taking a respite, while the 3-day Rate of Change (RoC) shifts neutral.
Technical Levels: Supports and Resistances
EURJPY currently trading at 149.24 at the time of writing. Pair opened at 149.87 and is trading with a change of -0.42 % .
| Overview | Overview.1 | |
|---|---|---|
| 0 | Today last price | 149.24 |
| 1 | Today Daily Change | -0.63 |
| 2 | Today Daily Change % | -0.42 |
| 3 | Today daily open | 149.87 |
The pair remains strongly bullish on the daily timeframe. It trades above its 20 SMA @ 148.55, 50 SMA 145.98, 100 SMA @ 143.99 and 200 SMA @ 143.4.
| Trends | Trends.1 | |
|---|---|---|
| 0 | Daily SMA20 | 148.55 |
| 1 | Daily SMA50 | 145.98 |
| 2 | Daily SMA100 | 143.99 |
| 3 | Daily SMA200 | 143.40 |
The previous day high was 149.93 while the previous day low was 148.84. The daily 38.2% Fib levels comes at 149.51, expected to provide resistance. Similarly, the daily 61.8% fib level is at 149.25, expected to provide resistance.
Note the levels of interest below:
- Pivot support is noted at 149.16, 148.46, 148.08
- Pivot resistance is noted at 150.25, 150.63, 151.34
| Levels | Levels.1 |
|---|---|
| Previous Daily High | 149.93 |
| Previous Daily Low | 148.84 |
| Previous Weekly High | 149.80 |
| Previous Weekly Low | 147.22 |
| Previous Monthly High | 150.44 |
| Previous Monthly Low | 142.55 |
| Daily Fibonacci 38.2% | 149.51 |
| Daily Fibonacci 61.8% | 149.25 |
| Daily Pivot Point S1 | 149.16 |
| Daily Pivot Point S2 | 148.46 |
| Daily Pivot Point S3 | 148.08 |
| Daily Pivot Point R1 | 150.25 |
| Daily Pivot Point R2 | 150.63 |
| Daily Pivot Point R3 | 151.34 |
[/s2If]
Nehcap Expert Advisor
The NEHCAP MT4 EA is high quality professional trading system geared to generate returns without using GRID or martingales. Each trade has strict risk per trade parameter. The pairs under management include EURUSD, GBPUSD, AUDCAD, AUDNZD,GBPAUD, EURAUD, EURCAD, CHFJPY and many more.
The system is trading live: LIVE ACCOUNT TRACKING
You can run it free. Apply for a free trial and track our account. Buy the system or use profit share mechanism to generate returns on your MT4.
Join Our Telegram Group
")


