#XAUUSD @ 2,011.97 Gold price remains pressured towards short-term key support after snapping two-week winning streak., @nehcap view: Further downside expected (Pivot Orderbook analysis)
…
This is a premium post.
[s2If !current_user_can(access_s2member_level4)]Please register for FREE REGISTER to read full post below containing analysis. In case of any error or you think you are not able to read the full post below, please email us at support#nehcap.com [lwa][/s2If] [s2If current_user_can(access_s2member_level1)]
- Gold price remains pressured towards short-term key support after snapping two-week winning streak.
- Risks emanating from the United States debt ceiling expiry, banking woes underpin US Dollar rebound and weigh on XAU/USD price.
- Gold price fails to cheer softer US inflation clues Federal Reserve bets suggesting policy pivot.
- US Retail Sales, Fed Chair Powell’s speech and debt ceiling drama will be crucial to watch for XAU/USD direction.
The pair currently trades last at 2011.97.
The previous day high was 2022.59 while the previous day low was 2000.95. The daily 38.2% Fib levels comes at 2009.22, expected to provide support. Similarly, the daily 61.8% fib level is at 2014.32, expected to provide resistance.
Gold price remains depressed around $2,010 as it seeks fresh clues to extend the three-week downtrend, especially after posting the first weekly loss in three. In doing so, the yellow metal portrays the market’s anxiety amid the United States debt ceiling jitters, as well as the banking fears. However, a light calendar and mixed updates from the Federal Reserve (Fed), as well as the US government officials, prod the XAU/USD bears ahead of this week’s key data/events.
Gold price bears the burden of concerns that the US may default in early June if the debt ceiling isn’t altered soon. The same seems to weigh on the market sentiment and underpin the US Dollar’s run-up. On the same line were fears emanating from the US banks as some of the mid-tier ones posted heavy drawdowns in share prices and deposits in the last week.
Further, hawkish comments from the Federal Reserve (Fed) officials also weigh on the XAU/USD. That said, Fed Governor Philip Jefferson and St. Louis Fed President James Bullard defend the US central bank’s current monetary policy while citing higher inflation as a major challenge. On the same line, Federal Reserve (Fed) Governor Michelle Bowman said Friday, “policy rate will need to remain sufficiently restrictive for some time.”
Recently, US President Joe Biden signaled that Friday’s delayed talks will be held on Tuesday. The same joins comments from US Treasury Secretary Wally Adeyemo who termed the debt-ceiling negotiations between the White House as “constructive,” to challenge the market pessimists and the US Dollar buyers. As a result, the Gold price remains depressed but the bears take a breather of late.
While the aforementioned catalysts weigh on the Gold price, the softer US inflation clues and downbeat data from other fronts fail to defend the XAU/USD price. On Friday, preliminary readings of the University of Michigan’s (UoM) Consumer Confidence Index for May dropped to 57.7 from 63.5 prior versus 63.0 market forecasts. More interestingly, the one-year inflation expectations dropped from 4.6% to 4.5% for the said month but 5-year counterpart rose to the highest reading since 2011, from 3.0% to 3.2%.
Looking ahead, Tuesday’s US debt ceiling talks will be the key for the Gold traders to watch for immediate directions. Following that, US Retail Sales and a speech from Fed Chairman Jerome Powell should be eyed closely.
Should the US policymakers fail to extend the debt ceiling, the Gold price may have a further downside to trace. Further, upbeat US data and hawkish comments from Fed’s Powell can also help the XAU/USD bears.
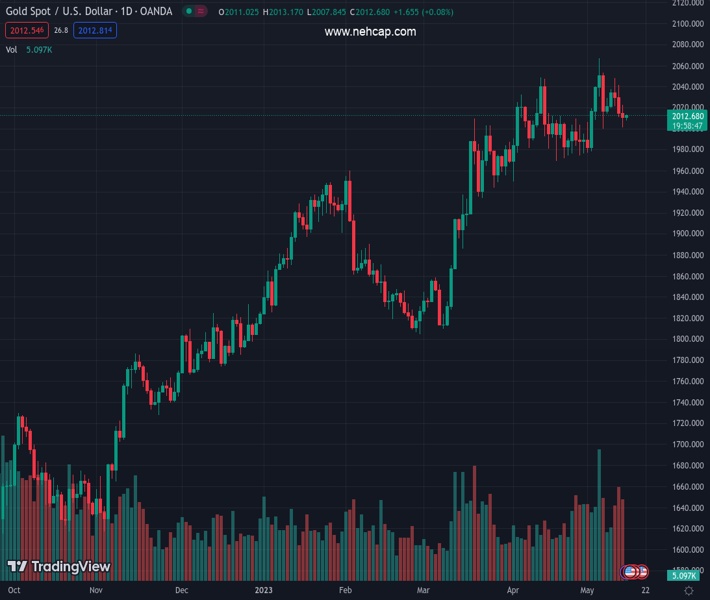
Gold price portrays a bearish triangle formation on the Daily chart, currently between $2,050 and $1,990. That said, the bearish signals from the Moving Average Convergence and Divergence (MACD) indicator, as well as the steady Relative Strength Index (RSI) line, placed at 14, also suggest further downside of the XAU/USD.
However, a clear break of the $1,990 support becomes necessary for the Gold price to aim for the theoretical target of around $1,875.
It’s worth noting, that the 21-DMA, near $2,007 by the press time, acts as an immediate support for the Gold price whereas the 50-DMA surrounding $1,972 and the $1,900 round figure may act as an intermediate halt for the XAU/USD between $1,990 and $1,875.
Alternatively, a daily closing beyond the $2,050 will defy the bearish triangle formation on the Gold price, a break of which could quickly propel the XAU/USD towards the previous yearly high of around $2,070 and then to the latest record-high of near $2,080.
Following that, the $2,100 round figure may act as an extra check for the Gold buyers.
Trend: Further downside expected
Technical Levels: Supports and Resistances
XAUUSD currently trading at 2009.68 at the time of writing. Pair opened at 2010.84 and is trading with a change of -0.06 % .
| Overview | Overview.1 | |
|---|---|---|
| 0 | Today last price | 2009.68 |
| 1 | Today Daily Change | -1.16 |
| 2 | Today Daily Change % | -0.06 |
| 3 | Today daily open | 2010.84 |
The pair remains strongly bullish on the daily timeframe. It trades above its 20 SMA @ 2007.66, 50 SMA 1972.43, 100 SMA @ 1919.95 and 200 SMA @ 1820.95.
| Trends | Trends.1 | |
|---|---|---|
| 0 | Daily SMA20 | 2007.66 |
| 1 | Daily SMA50 | 1972.43 |
| 2 | Daily SMA100 | 1919.95 |
| 3 | Daily SMA200 | 1820.95 |
The previous day high was 2022.59 while the previous day low was 2000.95. The daily 38.2% Fib levels comes at 2009.22, expected to provide support. Similarly, the daily 61.8% fib level is at 2014.32, expected to provide resistance.
Note the levels of interest below:
- Pivot support is noted at 2000.33, 1989.82, 1978.69
- Pivot resistance is noted at 2021.97, 2033.1, 2043.61
| Levels | Levels.1 |
|---|---|
| Previous Daily High | 2022.59 |
| Previous Daily Low | 2000.95 |
| Previous Weekly High | 2048.27 |
| Previous Weekly Low | 2000.95 |
| Previous Monthly High | 2048.75 |
| Previous Monthly Low | 1949.83 |
| Daily Fibonacci 38.2% | 2009.22 |
| Daily Fibonacci 61.8% | 2014.32 |
| Daily Pivot Point S1 | 2000.33 |
| Daily Pivot Point S2 | 1989.82 |
| Daily Pivot Point S3 | 1978.69 |
| Daily Pivot Point R1 | 2021.97 |
| Daily Pivot Point R2 | 2033.10 |
| Daily Pivot Point R3 | 2043.61 |
[/s2If]
Nehcap Expert Advisor
The NEHCAP MT4 EA is high quality professional trading system geared to generate returns without using GRID or martingales. Each trade has strict risk per trade parameter. The pairs under management include EURUSD, GBPUSD, AUDCAD, AUDNZD,GBPAUD, EURAUD, EURCAD, CHFJPY and many more.
The system is trading live: LIVE ACCOUNT TRACKING
You can run it free. Apply for a free trial and track our account. Buy the system or use profit share mechanism to generate returns on your MT4.
Join Our Telegram Group
")


