Oil price is expected to find acceptance below $70.00 as US debt-ceiling issues are escalating. (Pivot Orderbook analysis)
…
This is a premium post.
[s2If !current_user_can(access_s2member_level4)]Please register for FREE REGISTER to read full post below containing analysis. In case of any error or you think you are not able to read the full post below, please email us at support#nehcap.com [lwa][/s2If] [s2If current_user_can(access_s2member_level1)]
- Oil price is expected to find acceptance below $70.00 as US debt-ceiling issues are escalating.
- The US Treasury will be out of funds for making obligated payments on the failure of raising the US debt ceiling.
- A recovery move by the oil price to near $71.75 has retreated as support became resistance for the oil bulls.
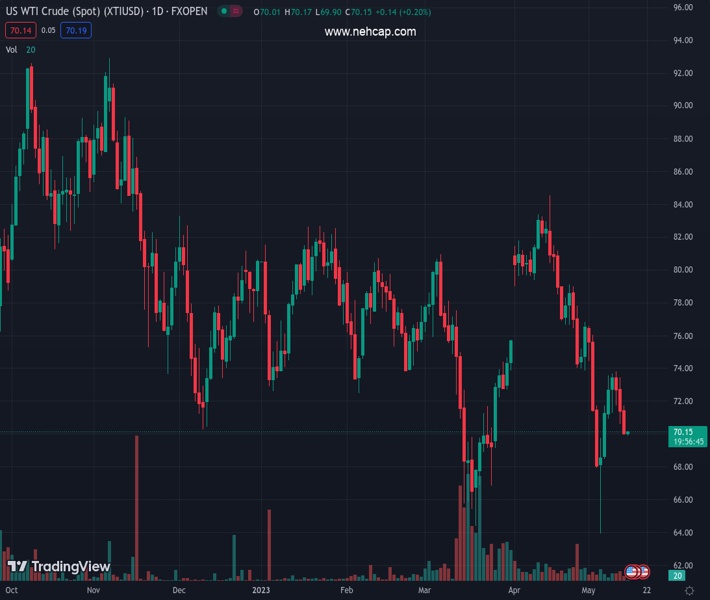
The pair currently trades last at 70.19.
The previous day high was 71.77 while the previous day low was 69.94. The daily 38.2% Fib levels comes at 70.64, expected to provide resistance. Similarly, the daily 61.8% fib level is at 71.07, expected to provide resistance.
West Texas Intermediate (WTI), futures on NYMEX, are showing quite a sideways performance around $70.00 in the Asian session. The oil price is continuously facing selling pressure as a delay in negotiations over the United States borrowing cap limit has deepened fears of a recession in the economy.
The street is worried as if the White House and top Republican leaders fail to reach a decisive action, the US Treasury will be out of funds for making obligated payments on the failure of increasing US debt-ceiling, which will result in a huge loss of production scale and millions of jobs.
Meanwhile, oil prices have failed to capitalize on rising odds of a pause in the policy-tightening spell by the Federal Reserve (Fed). The US Dollar Index (DXY) has refreshed its monthly high above 102.73.
Oil prices witnessed a sell-off after a breakdown of the Ascending Triangle chart pattern formed on an hourly scale. A recovery move by the oil price to near $71.75 has retreated as support became resistance for the oil bulls.
The 50-period Exponential Moving Average (EMA) at $71.13 is acting as a barricade for the oil bulls.
Meanwhile, the Relative Strength Index (RSI) (14) is oscillating in the bearish range of 20.00-40.00, signaling more weakness ahead.
A further breakdown below May 12 low at $69.94 will expose the asset to May 03 low at $97.92. A slippage below the latter will expose the asset to May 04 low at $63.60.
On the flip side, a solid recovery above May 10 high at $73.80 will allow the asset for further upside towards May 02 high at $76.06. A breach of the latter will expose the asset to April 26 high around $78.00.
Technical Levels: Supports and Resistances
XTIUSD currently trading at 70.19 at the time of writing. Pair opened at 70.06 and is trading with a change of 0.19 % .
| Overview | Overview.1 | |
|---|---|---|
| 0 | Today last price | 70.19 |
| 1 | Today Daily Change | 0.13 |
| 2 | Today Daily Change % | 0.19 |
| 3 | Today daily open | 70.06 |
The pair remains strongly bearish on the daily time frame. It trades below the 20 SMA @ 74.64, 50 SMA 75.14, 100 SMA @ 76.58 and 200 SMA @ 80.49.
| Trends | Trends.1 | |
|---|---|---|
| 0 | Daily SMA20 | 74.64 |
| 1 | Daily SMA50 | 75.14 |
| 2 | Daily SMA100 | 76.58 |
| 3 | Daily SMA200 | 80.49 |
The previous day high was 71.77 while the previous day low was 69.94. The daily 38.2% Fib levels comes at 70.64, expected to provide resistance. Similarly, the daily 61.8% fib level is at 71.07, expected to provide resistance.
Note the levels of interest below:
- Pivot support is noted at 69.41, 68.75, 67.57
- Pivot resistance is noted at 71.24, 72.43, 73.08
| Levels | Levels.1 |
|---|---|
| Previous Daily High | 71.77 |
| Previous Daily Low | 69.94 |
| Previous Weekly High | 73.81 |
| Previous Weekly Low | 69.94 |
| Previous Monthly High | 83.40 |
| Previous Monthly Low | 73.88 |
| Daily Fibonacci 38.2% | 70.64 |
| Daily Fibonacci 61.8% | 71.07 |
| Daily Pivot Point S1 | 69.41 |
| Daily Pivot Point S2 | 68.75 |
| Daily Pivot Point S3 | 67.57 |
| Daily Pivot Point R1 | 71.24 |
| Daily Pivot Point R2 | 72.43 |
| Daily Pivot Point R3 | 73.08 |
[/s2If]
Nehcap Expert Advisor
The NEHCAP MT4 EA is high quality professional trading system geared to generate returns without using GRID or martingales. Each trade has strict risk per trade parameter. The pairs under management include EURUSD, GBPUSD, AUDCAD, AUDNZD,GBPAUD, EURAUD, EURCAD, CHFJPY and many more.
The system is trading live: LIVE ACCOUNT TRACKING
You can run it free. Apply for a free trial and track our account. Buy the system or use profit share mechanism to generate returns on your MT4.
Join Our Telegram Group
")


