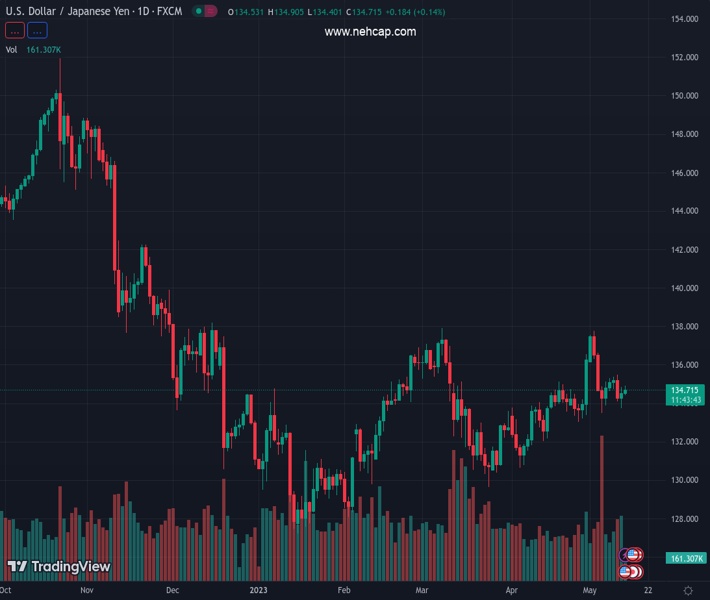
#USDJPY @ 134.735 gains traction for the second straight day, albeit lacks any follow-through. (Pivot Orderbook analysis)
…
This is a premium post.
[s2If !current_user_can(access_s2member_level4)]Please register for FREE REGISTER to read full post below containing analysis. In case of any error or you think you are not able to read the full post below, please email us at support#nehcap.com [lwa][/s2If] [s2If current_user_can(access_s2member_level1)]
- USD/JPY gains traction for the second straight day, albeit lacks any follow-through.
- A combination of factors undermines the JPY and acts as a tailwind for the major.
- The USD stands tall near a one-week high and remains supportive of the move up.
The pair currently trades last at 134.735.
The previous day high was 134.84 while the previous day low was 133.74. The daily 38.2% Fib levels comes at 134.42, expected to provide support. Similarly, the daily 61.8% fib level is at 134.16, expected to provide support.
The USD/JPY pair builds on the overnight goodish rebound from the 133.75 region, or a one-week low. and gains some follow-through traction for the second successive day on Friday. The pair maintains its bid tone through the early part of the European session and is currently placed around the 134.70 region, up over 0.20% for the day.
A generally positive tone around the equity markets, along with the Bank of Japan’s (BoJ) dovish outlook, undermines the safe-haven Japanese Yen (JPY) and turns out to be a key factor acting as a tailwind for the USD/JPY pair. It is worth recalling that the BoJ Governor Kazuo Ueda, speaking in parliament earlier this week, said it was too early to discuss specific plans for an exit from the massive stimulus programme.
The US Dollar (USD), on the other hand, reverses a modest intraday dip and stands tall near a one-and-half-week high touched on Thursday, which, in turn, lends additional support to the USD/JPY pair. The uncertainty over the Federal Reserve’s (Fed) next policy move, along with a modest uptick in the US Treasury bond yields, continue to underpin the Greenback, though the US debt ceiling concerns act as a headwind.
The US CPI report released earlier this week pointed to signs of easing inflationary pressure and reaffirmed market expectations about an imminent pause in the Fed’s year-long rate-hiking cycle. Investors, however, remain divided over the possibility of rate cuts later this year. This, in turn, holds back the USD bulls from placing aggressive bets and might keep a lid on any meaningful upside for the USD/JPY pair, at least for now.
Market participants now look forward to the release of the Preliminary Michigan Consumer Sentiment Index from the US, due later during the early North American session. This, along with the US bond yields, will influence the USD price dynamics and provide some impetus to the USD/JPY pair. Apart from this, traders will take cues from the broader risk sentiment to grab short-term opportunities on the last day of the week.
Technical Levels: Supports and Resistances
USDJPY currently trading at 134.72 at the time of writing. Pair opened at 134.42 and is trading with a change of 0.22 % .
| Overview | Overview.1 | |
|---|---|---|
| 0 | Today last price | 134.72 |
| 1 | Today Daily Change | 0.30 |
| 2 | Today Daily Change % | 0.22 |
| 3 | Today daily open | 134.42 |
The pair is trading above its 20 Daily moving average @ 134.71, above its 50 Daily moving average @ 133.76 , above its 100 Daily moving average @ 132.89 and below its 200 Daily moving average @ 137.03
| Trends | Trends.1 | |
|---|---|---|
| 0 | Daily SMA20 | 134.71 |
| 1 | Daily SMA50 | 133.76 |
| 2 | Daily SMA100 | 132.89 |
| 3 | Daily SMA200 | 137.03 |
The previous day high was 134.84 while the previous day low was 133.74. The daily 38.2% Fib levels comes at 134.42, expected to provide support. Similarly, the daily 61.8% fib level is at 134.16, expected to provide support.
Note the levels of interest below:
- Pivot support is noted at 133.83, 133.24, 132.73
- Pivot resistance is noted at 134.93, 135.43, 136.03
| Levels | Levels.1 |
|---|---|
| Previous Daily High | 134.84 |
| Previous Daily Low | 133.74 |
| Previous Weekly High | 137.78 |
| Previous Weekly Low | 133.50 |
| Previous Monthly High | 136.56 |
| Previous Monthly Low | 130.63 |
| Daily Fibonacci 38.2% | 134.42 |
| Daily Fibonacci 61.8% | 134.16 |
| Daily Pivot Point S1 | 133.83 |
| Daily Pivot Point S2 | 133.24 |
| Daily Pivot Point S3 | 132.73 |
| Daily Pivot Point R1 | 134.93 |
| Daily Pivot Point R2 | 135.43 |
| Daily Pivot Point R3 | 136.03 |
[/s2If]
Nehcap Expert Advisor
The NEHCAP MT4 EA is high quality professional trading system geared to generate returns without using GRID or martingales. Each trade has strict risk per trade parameter. The pairs under management include EURUSD, GBPUSD, AUDCAD, AUDNZD,GBPAUD, EURAUD, EURCAD, CHFJPY and many more.
The system is trading live: LIVE ACCOUNT TRACKING
You can run it free. Apply for a free trial and track our account. Buy the system or use profit share mechanism to generate returns on your MT4.
Join Our Telegram Group
")


