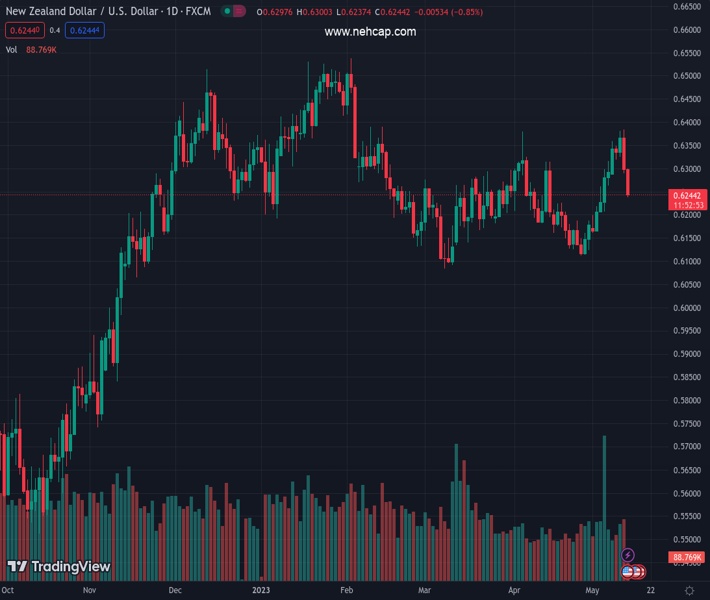
#NZDUSD @ 0.62453 drifts lower for the second successive day and dives to over a one-week low on Friday. (Pivot Orderbook analysis)
…
This is a premium post.
[s2If !current_user_can(access_s2member_level4)]Please register for FREE REGISTER to read full post below containing analysis. In case of any error or you think you are not able to read the full post below, please email us at support#nehcap.com [lwa][/s2If] [s2If current_user_can(access_s2member_level1)]
- NZD/USD drifts lower for the second successive day and dives to over a one-week low on Friday.
- Worries about a global economic slowdown continue to weigh heavily on the risk-sensitive Kiwi.
- A modest USD downtick lends support, though the fundamental backdrop favours bearish traders.
The pair currently trades last at 0.62453.
The previous day high was 0.6385 while the previous day low was 0.6289. The daily 38.2% Fib levels comes at 0.6326, expected to provide resistance. Similarly, the daily 61.8% fib level is at 0.6348, expected to provide resistance.
The NZD/USD pair extends the previous day’s sharp retracement slide from the 0.6385 region, or a nearly three-month high and remains under heavy selling pressure for the second successive day on Friday. The pair drops to over a one-week low during the early European session, albeit shows some resilience below a technically significant 200-day Simple Moving Average (SMA) and currently trades around the 0.6260-0.6250 area, still down over 0.60% for the day.
The mixed Chinese inflation data and a weaker US labor market report released on Thursday raised concerns about a global economic slowdown, which, in turn, is seen as a key factor driving flows away from the risk-sensitive Kiwi. That said, a modest uptick in the US equity futures and a softer US Dollar hold back traders from placing fresh bearish bets around the NZD/USD pair. Apart from this, expectations for further rate hikes by the Reserve Bank of New Zealand (RBNZ) lend some support to the major, at least for the time being.
The USD downtick, meanwhile, is likely to remain cushioned amid the uncertainty over the Federal Reserve’s (Fed) next policy move. The US CPI report released on Wednesday pointed to further signs of easing inflationary pressures and should allow the US central bank to pause its year-long rate-hiking cycle. Investors, however, remain divided over the possibility of a rate cut later this year. This, in turn, acts as a tailwind for the US Treasury bond yields, which should limit the USD losses and cap any intraday recovery for the NZD/USD pair.
The aforementioned fundamental backdrop supports prospects for a further near-term depreciating move, though traders need to wait for a break and acceptance below the 200 DMA is needed before placing fresh bearish bets. Market participants now look to the release of the Preliminary Michigan Consumer Sentiment Index from the US later during the early North American session. This, along with the broader risk sentiment and the US bond yields, will influence the USD price dynamics and provide some impetus to the NZD/USD pair.
Technical Levels: Supports and Resistances
NZDUSD currently trading at 0.6263 at the time of writing. Pair opened at 0.6298 and is trading with a change of -0.56 % .
| Overview | Overview.1 | |
|---|---|---|
| 0 | Today last price | 0.6263 |
| 1 | Today Daily Change | -0.0035 |
| 2 | Today Daily Change % | -0.5600 |
| 3 | Today daily open | 0.6298 |
The pair is trading above its 20 Daily moving average @ 0.6218, above its 50 Daily moving average @ 0.622 , below its 100 Daily moving average @ 0.628 and above its 200 Daily moving average @ 0.6161
| Trends | Trends.1 | |
|---|---|---|
| 0 | Daily SMA20 | 0.6218 |
| 1 | Daily SMA50 | 0.6220 |
| 2 | Daily SMA100 | 0.6280 |
| 3 | Daily SMA200 | 0.6161 |
The previous day high was 0.6385 while the previous day low was 0.6289. The daily 38.2% Fib levels comes at 0.6326, expected to provide resistance. Similarly, the daily 61.8% fib level is at 0.6348, expected to provide resistance.
Note the levels of interest below:
- Pivot support is noted at 0.6263, 0.6228, 0.6167
- Pivot resistance is noted at 0.6359, 0.642, 0.6455
| Levels | Levels.1 |
|---|---|
| Previous Daily High | 0.6385 |
| Previous Daily Low | 0.6289 |
| Previous Weekly High | 0.6316 |
| Previous Weekly Low | 0.6160 |
| Previous Monthly High | 0.6389 |
| Previous Monthly Low | 0.6111 |
| Daily Fibonacci 38.2% | 0.6326 |
| Daily Fibonacci 61.8% | 0.6348 |
| Daily Pivot Point S1 | 0.6263 |
| Daily Pivot Point S2 | 0.6228 |
| Daily Pivot Point S3 | 0.6167 |
| Daily Pivot Point R1 | 0.6359 |
| Daily Pivot Point R2 | 0.6420 |
| Daily Pivot Point R3 | 0.6455 |
[/s2If]
Nehcap Expert Advisor
The NEHCAP MT4 EA is high quality professional trading system geared to generate returns without using GRID or martingales. Each trade has strict risk per trade parameter. The pairs under management include EURUSD, GBPUSD, AUDCAD, AUDNZD,GBPAUD, EURAUD, EURCAD, CHFJPY and many more.
The system is trading live: LIVE ACCOUNT TRACKING
You can run it free. Apply for a free trial and track our account. Buy the system or use profit share mechanism to generate returns on your MT4.
Join Our Telegram Group
")


