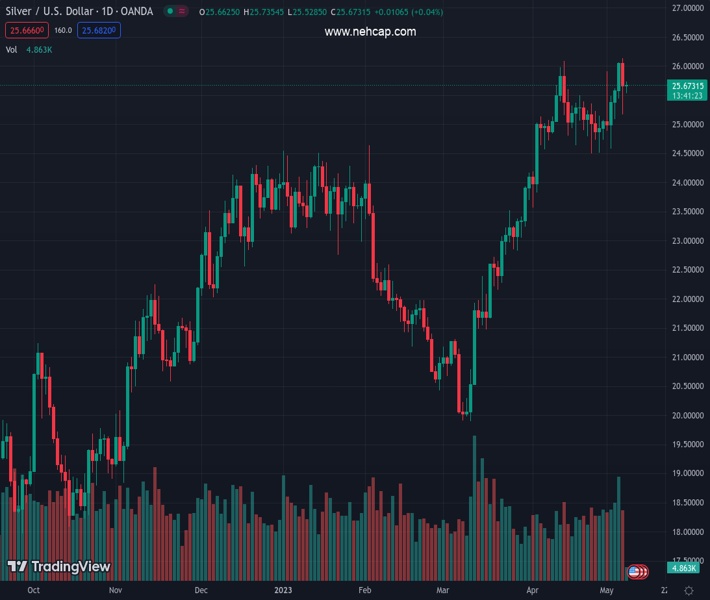
#XAGUSD @ 25.666 Silver oscillates in a narrow trading band through the first half of trading on Monday. (Pivot Orderbook analysis)
…
This is a premium post.
[s2If !current_user_can(access_s2member_level4)]Please register for FREE REGISTER to read full post below containing analysis. In case of any error or you think you are not able to read the full post below, please email us at support#nehcap.com [lwa][/s2If] [s2If current_user_can(access_s2member_level1)]
- Silver oscillates in a narrow trading band through the first half of trading on Monday.
- The technical setup favours bullish traders and supports prospects for further gains.
- A convincing break below the $24.50-40 area is needed to negate the positive bias.
The pair currently trades last at 25.666.
The previous day high was 26.14 while the previous day low was 25.17. The daily 38.2% Fib levels comes at 25.54, expected to provide support. Similarly, the daily 61.8% fib level is at 25.77, expected to provide resistance.
Silver fails to capitalize on Friday’s bounce from the 200-hour Simple Moving Average (SMA) and oscillates in a narrow trading band through the early European session on the first day of a new week. The white metal currently trades around the $25.65-$2,5.70 region, nearly unchanged for the day, though the technical setup favours bullish traders.
The recently repeated rebounds from the $24.50-$24.40 strong horizontal resistance breakpoint, now turned support, and the emergence of some dip-buying on Friday validates the near-term positive outlook. Moreover, the Relative Strength Index (RSI) on the daily chart has eased from the overbought territory and supports prospects for a further appreciating move.
That said, the XAG/USD has been struggling to build on its momentum beyond the $26.00 mark, making it prudent to wait for a sustained strength beyond the said handle before placing fresh bullish bets. The commodity might then surpass an intermediate barrier near the $26.25-$26.30 and aim to test the March 2022 swing high, just ahead of the $27.00 round figure.
On the flip side, Friday’s swing low, around the $25.15 region now seems to protect the immediate downside. This is closely followed by the $25.00 psychological mark, below which the XAG/USD could extend the corrective decline towards testing the $24.50-$24.40 resistance-turned-support. A convincing break below the latter could negate the positive outlook.
The XAG/USD might then turn vulnerable to weaken further below the $24.00 mark and drop to the next relevant support near the $23.50-$23.30 confluence. The latter comprises the 50-day and the 100-day SMAs and is followed by support near the $23.00 round-figure mark.
Technical Levels: Supports and Resistances
XAGUSD currently trading at 25.67 at the time of writing. Pair opened at 25.66 and is trading with a change of 0.04 % .
| Overview | Overview.1 | |
|---|---|---|
| 0 | Today last price | 25.67 |
| 1 | Today Daily Change | 0.01 |
| 2 | Today Daily Change % | 0.04 |
| 3 | Today daily open | 25.66 |
The pair remains strongly bullish on the daily timeframe. It trades above its 20 SMA @ 25.26, 50 SMA 23.46, 100 SMA @ 23.32 and 200 SMA @ 21.73.
| Trends | Trends.1 | |
|---|---|---|
| 0 | Daily SMA20 | 25.26 |
| 1 | Daily SMA50 | 23.46 |
| 2 | Daily SMA100 | 23.32 |
| 3 | Daily SMA200 | 21.73 |
The previous day high was 26.14 while the previous day low was 25.17. The daily 38.2% Fib levels comes at 25.54, expected to provide support. Similarly, the daily 61.8% fib level is at 25.77, expected to provide resistance.
Note the levels of interest below:
- Pivot support is noted at 25.17, 24.69, 24.2
- Pivot resistance is noted at 26.14, 26.62, 27.11
| Levels | Levels.1 |
|---|---|
| Previous Daily High | 26.14 |
| Previous Daily Low | 25.17 |
| Previous Weekly High | 26.14 |
| Previous Weekly Low | 24.58 |
| Previous Monthly High | 26.09 |
| Previous Monthly Low | 23.57 |
| Daily Fibonacci 38.2% | 25.54 |
| Daily Fibonacci 61.8% | 25.77 |
| Daily Pivot Point S1 | 25.17 |
| Daily Pivot Point S2 | 24.69 |
| Daily Pivot Point S3 | 24.20 |
| Daily Pivot Point R1 | 26.14 |
| Daily Pivot Point R2 | 26.62 |
| Daily Pivot Point R3 | 27.11 |
[/s2If]
Nehcap Expert Advisor
The NEHCAP MT4 EA is high quality professional trading system geared to generate returns without using GRID or martingales. Each trade has strict risk per trade parameter. The pairs under management include EURUSD, GBPUSD, AUDCAD, AUDNZD,GBPAUD, EURAUD, EURCAD, CHFJPY and many more.
The system is trading live: LIVE ACCOUNT TRACKING
You can run it free. Apply for a free trial and track our account. Buy the system or use profit share mechanism to generate returns on your MT4.
Join Our Telegram Group
")


