#USDJPY @ 134.843 holds lower ground near intraday low after reversing from 50-SMA., @nehcap view: Further upside expected (Pivot Orderbook analysis)
…
This is a premium post.
[s2If !current_user_can(access_s2member_level4)]Please register for FREE REGISTER to read full post below containing analysis. In case of any error or you think you are not able to read the full post below, please email us at support#nehcap.com [lwa][/s2If] [s2If current_user_can(access_s2member_level1)]
- USD/JPY holds lower ground near intraday low after reversing from 50-SMA.
- 61.8% Fibonacci retracement level restricts immediate downside ahead of six-week-old support line, 200-SMA.
- Multiple hurdles toward the north stand tall to challenge Yen pair buyers past 50-SMA, oscillators favor further upside.
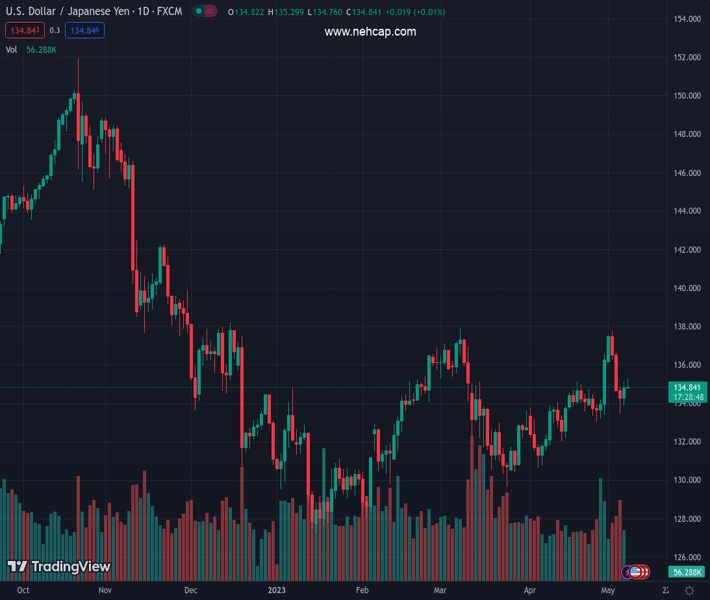
The pair currently trades last at 134.843.
The previous day high was 135.12 while the previous day low was 133.88. The daily 38.2% Fib levels comes at 134.65, expected to provide support. Similarly, the daily 61.8% fib level is at 134.36, expected to provide support.
USD/JPY bulls struggle to keep the reins after snapping three-day downtrend the previous day. That said, the Yen pair retreats to 134.90 during early Monday, following an initial run-up to prod the 50-SMA hurdle, favored by the March month’s Monetary Policy Meeting Minutes from the Bank of Japan (BoJ).
Also read: BoJ Minutes: Several members said must be vigilant to risk inflation may accelerate more than expected
Even so, the Yen pair remains above the 61.8% Fibonacci retracement level of its March month downside, near 134.75, which in turn keeps the buyers hopeful. Adding strength to the upside bias are the bullish MACD signals and the near-50 RSI (14) line suggesting a continuation of the latest rebound from an upward-sloping support line from late March.
With this, the USD/JPY bulls appear well-set to cross the 50-SMA hurdle surrounding 135.25. However, lows marked during early March around 135.30-40 can challenge the pair’s further upside.
Also acting as the upside hurdle are the multiple levels around the 137.00 round figure, as well as double tops marked near 137.80-90. Furthermore, the 138.00 threshold acts as the last defense of the USD/JPY bears.
On the contrary, a downside break of the aforementioned support line, close to the 134.00 round figure, isn’t an open welcome to the Yen pair bears as the 200-SMA level of 133.40 can act as an additional filter to the south.
Trend: Further upside expected
Technical Levels: Supports and Resistances
USDJPY currently trading at 134.84 at the time of writing. Pair opened at 134.83 and is trading with a change of 0.01% % .
| Overview | Overview.1 | |
|---|---|---|
| 0 | Today last price | 134.84 |
| 1 | Today Daily Change | 0.01 |
| 2 | Today Daily Change % | 0.01% |
| 3 | Today daily open | 134.83 |
The pair is trading above its 20 Daily moving average @ 134.41, above its 50 Daily moving average @ 133.88 , above its 100 Daily moving average @ 132.84 and below its 200 Daily moving average @ 136.99
| Trends | Trends.1 | |
|---|---|---|
| 0 | Daily SMA20 | 134.41 |
| 1 | Daily SMA50 | 133.88 |
| 2 | Daily SMA100 | 132.84 |
| 3 | Daily SMA200 | 136.99 |
The previous day high was 135.12 while the previous day low was 133.88. The daily 38.2% Fib levels comes at 134.65, expected to provide support. Similarly, the daily 61.8% fib level is at 134.36, expected to provide support.
Note the levels of interest below:
- Pivot support is noted at 134.1, 133.37, 132.86
- Pivot resistance is noted at 135.34, 135.85, 136.58
| Levels | Levels.1 |
|---|---|
| Previous Daily High | 135.12 |
| Previous Daily Low | 133.88 |
| Previous Weekly High | 137.78 |
| Previous Weekly Low | 133.50 |
| Previous Monthly High | 136.56 |
| Previous Monthly Low | 130.63 |
| Daily Fibonacci 38.2% | 134.65 |
| Daily Fibonacci 61.8% | 134.36 |
| Daily Pivot Point S1 | 134.10 |
| Daily Pivot Point S2 | 133.37 |
| Daily Pivot Point S3 | 132.86 |
| Daily Pivot Point R1 | 135.34 |
| Daily Pivot Point R2 | 135.85 |
| Daily Pivot Point R3 | 136.58 |
[/s2If]
Nehcap Expert Advisor
The NEHCAP MT4 EA is high quality professional trading system geared to generate returns without using GRID or martingales. Each trade has strict risk per trade parameter. The pairs under management include EURUSD, GBPUSD, AUDCAD, AUDNZD,GBPAUD, EURAUD, EURCAD, CHFJPY and many more.
The system is trading live: LIVE ACCOUNT TRACKING
You can run it free. Apply for a free trial and track our account. Buy the system or use profit share mechanism to generate returns on your MT4.
Join Our Telegram Group
")


