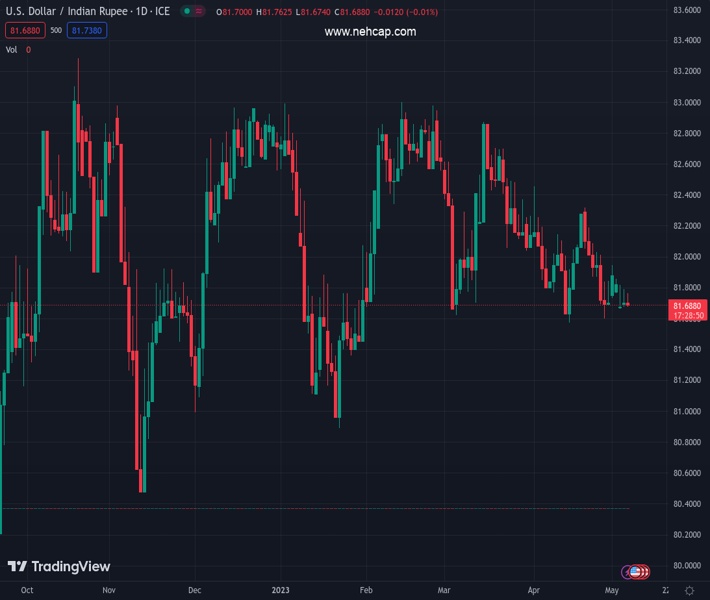
#USDINR @ 81.7050 is gyrating in a range of 81.64-81.95 from the past week. (Pivot Orderbook analysis)
…
This is a premium post.
[s2If !current_user_can(access_s2member_level4)]Please register for FREE REGISTER to read full post below containing analysis. In case of any error or you think you are not able to read the full post below, please email us at support#nehcap.com [lwa][/s2If] [s2If current_user_can(access_s2member_level1)]
- USD/INR is gyrating in a range of 81.64-81.95 from the past week.
- The upside is capped due to a sell-off in the USD Index while the downside is being supported by rising oil prices.
- Investors expect that the majority of central banks have reached threshold levels and the worst is getting over.
The pair currently trades last at 81.7050.
The previous day high was 81.8475 while the previous day low was 81.6435. The daily 38.2% Fib levels comes at 81.7696, expected to provide resistance. Similarly, the daily 61.8% fib level is at 81.7214, expected to provide resistance.
The USD/INR pair has sensed pressure while attempting to climb above the immediate resistance of 81.75 in the Asian session. The asset has been oscillating in a narrow range for the past week despite a sheer decline in the US Dollar Index (DXY).
It looks like a solid recovery in the oil price has offset the decline in the USD Index and the context is keeping the asset inside the woods. The oil price has shown a stellar recovery as investors expect that the majority of central banks have reached threshold levels and the worst is getting over. It is worth noting that India is one of the largest importers of oil in the world and higher oil prices impact the Indian rupee.
This week, the release of the US inflation data will be keenly watched, which is scheduled for Wednesday. Also, the Indian economy will have its inflation report on Friday.
USD/INR is oscillating in a narrow range of 81.64-81.95 for the past week, indicating a decline in volatility contraction. It seems that the release of inflation figures will trigger a power-pack action in the asset.
The 20-period Exponential Moving Average (EMA) at 81.73 is stuck to the major, portraying a rangebound performance.
Also, the Relative Strength Index (RSI) (14) is locked in the 40.00-60.00 range, hinting at an absence of momentum.
Going forward, a breakdown of the consolidation range below 81.60 will expose the asset to April 14 low at 81.50 followed by 26 January low at 81.36.
On the flip side, a strong move above May 02 high at 81.95 will drive the major toward April 26 high at 82.12. A breach of the latter will add more gains in the asset by pushing it toward April 21 high at 82.30.
Technical Levels: Supports and Resistances
USDINR currently trading at 81.708 at the time of writing. Pair opened at 81.7269 and is trading with a change of -0.02 % .
| Overview | Overview.1 | |
|---|---|---|
| 0 | Today last price | 81.7080 |
| 1 | Today Daily Change | -0.0189 |
| 2 | Today Daily Change % | -0.0200 |
| 3 | Today daily open | 81.7269 |
The pair is trading below its 20 Daily moving average @ 81.9002, below its 50 Daily moving average @ 82.1086 , below its 100 Daily moving average @ 82.1892 and above its 200 Daily moving average @ 81.6265
| Trends | Trends.1 | |
|---|---|---|
| 0 | Daily SMA20 | 81.9002 |
| 1 | Daily SMA50 | 82.1086 |
| 2 | Daily SMA100 | 82.1892 |
| 3 | Daily SMA200 | 81.6265 |
The previous day high was 81.8475 while the previous day low was 81.6435. The daily 38.2% Fib levels comes at 81.7696, expected to provide resistance. Similarly, the daily 61.8% fib level is at 81.7214, expected to provide resistance.
Note the levels of interest below:
- Pivot support is noted at 81.6311, 81.5353, 81.4271
- Pivot resistance is noted at 81.8351, 81.9433, 82.0391
| Levels | Levels.1 |
|---|---|
| Previous Daily High | 81.8475 |
| Previous Daily Low | 81.6435 |
| Previous Weekly High | 81.9525 |
| Previous Weekly Low | 81.6435 |
| Previous Monthly High | 82.5092 |
| Previous Monthly Low | 81.4850 |
| Daily Fibonacci 38.2% | 81.7696 |
| Daily Fibonacci 61.8% | 81.7214 |
| Daily Pivot Point S1 | 81.6311 |
| Daily Pivot Point S2 | 81.5353 |
| Daily Pivot Point S3 | 81.4271 |
| Daily Pivot Point R1 | 81.8351 |
| Daily Pivot Point R2 | 81.9433 |
| Daily Pivot Point R3 | 82.0391 |
[/s2If]
Nehcap Expert Advisor
The NEHCAP MT4 EA is high quality professional trading system geared to generate returns without using GRID or martingales. Each trade has strict risk per trade parameter. The pairs under management include EURUSD, GBPUSD, AUDCAD, AUDNZD,GBPAUD, EURAUD, EURCAD, CHFJPY and many more.
The system is trading live: LIVE ACCOUNT TRACKING
You can run it free. Apply for a free trial and track our account. Buy the system or use profit share mechanism to generate returns on your MT4.
Join Our Telegram Group
")


