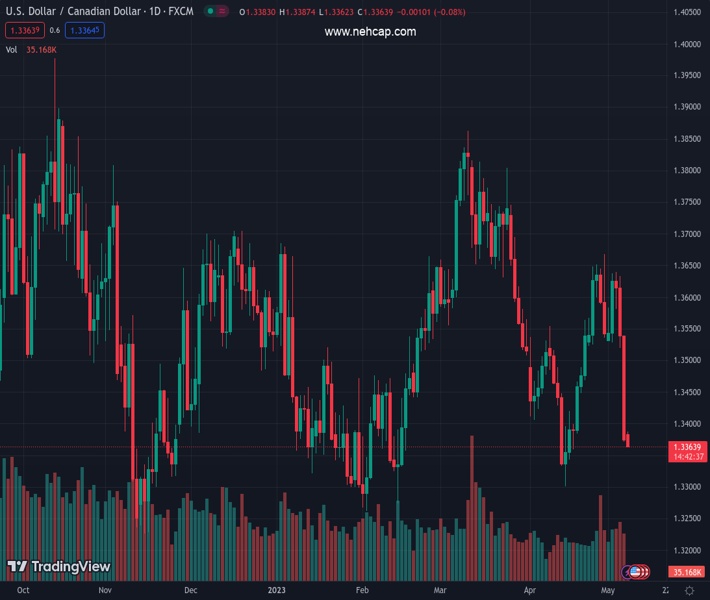
#USDCAD @ 1.33637 remains depressed at multi-day low after falling the most since January. (Pivot Orderbook analysis)
…
This is a premium post.
[s2If !current_user_can(access_s2member_level4)]Please register for FREE REGISTER to read full post below containing analysis. In case of any error or you think you are not able to read the full post below, please email us at support#nehcap.com [lwa][/s2If] [s2If current_user_can(access_s2member_level1)]
- USD/CAD remains depressed at multi-day low after falling the most since January.
- Comparatively strong Canadian jobs report, Oil price recovery favor Loonie pair buyers.
- NFP fails to underpin US Dollar rebound as traders seek more clues from US inflation.
- Canada geopolitics, US CPI eyed for clear directions.
The pair currently trades last at 1.33637.
The previous day high was 1.3542 while the previous day low was 1.3371. The daily 38.2% Fib levels comes at 1.3436, expected to provide resistance. Similarly, the daily 61.8% fib level is at 1.3476, expected to provide resistance.
USD/CAD stays pressured at the lowest levels in three weeks, close to 1.3380 amid early Monday morning in Europe. That said, the Loonie pair dropped the most in four months the previous day amid a strong Canada jobs report, versus unimpressive details of the US Nonfarm Payrolls (NFP). Adding strength to the quote’s bearish performance was the recovery in the Oil price, Canada’s main export item.
On Friday, Canada’s jobs report for April came in upbeat with Net Change in Employment rising by 41.4K versus 20K expected and 34.7K prior. Further, the Unemployment reprints 5.0% market compared to market forecasts of rising to 5.1% whereas Average Hourly Wages and Participation Rate remained unchanged at 5.2% YoY and 65.6% in that order. Upbeat Canadian jobs report joins hawkish comments from the Bank of Canada (BoC) Governor Tiff Mackem to weigh on the USD/CAD price.
On the other hand, a downward revision of the US Nonfarm Payrolls (NFP) supersedes the upbeat headline numbers and weighs on the US Dollar despite hawkish comments from St. Louis Federal Reserve President James Bullard.
Further, WTI crude oil prints a three-day uptrend as it extends a corrective bounce from the lowest levels since December 2021 to $71.70 heading into Monday’s European session, amid a softer US Dollar and cautious optimism in the market.
That said, hopes for the US policymakers’ ability to tackle looming default fears, ahead of Tuesday’s meeting of US President Joe Biden with the White House with Republican House Speaker Kevin McCarthy, Republican Senate Minority Leader Mitch McConnell and top congressional Democrats to discuss the debt ceiling issue also weigh on USD/CAD price.
It’s worth noting that US Treasury Secretary Janet Yellen on Sunday issued a stark warning that a failure by Congress to act on the debt ceiling could trigger a “constitutional crisis” that also would call into question the federal government’s creditworthiness, per Reuters.
Against this backdrop, the S&P 500 Futures print mild losses near 4,147 after posting a stellar run-up on Friday whereas the US 10-year Treasury bond yields dropped 1.5 basis points (bps) to 3.43%, pressured for the third consecutive week.
Looking forward, an emergency in Canada’s key Oil producing state Alberta, due to wildfire, challenges the USD/CAD bears ahead of the key US Consumer Price Index (CPI) for April.
A daily closing below the 200-DMA, around 1.3450 at the latest, again directs USD/CAD price toward an upward-sloping support line from November 2022, close to 1.3310 by the press time.
Technical Levels: Supports and Resistances
USDCAD currently trading at 1.3372 at the time of writing. Pair opened at 1.3374 and is trading with a change of -0.01% % .
| Overview | Overview.1 | |
|---|---|---|
| 0 | Today last price | 1.3372 |
| 1 | Today Daily Change | -0.0002 |
| 2 | Today Daily Change % | -0.01% |
| 3 | Today daily open | 1.3374 |
The pair remains strongly bearish on the daily time frame. It trades below the 20 SMA @ 1.3502, 50 SMA 1.3585, 100 SMA @ 1.3524 and 200 SMA @ 1.3446.
| Trends | Trends.1 | |
|---|---|---|
| 0 | Daily SMA20 | 1.3502 |
| 1 | Daily SMA50 | 1.3585 |
| 2 | Daily SMA100 | 1.3524 |
| 3 | Daily SMA200 | 1.3446 |
The previous day high was 1.3542 while the previous day low was 1.3371. The daily 38.2% Fib levels comes at 1.3436, expected to provide resistance. Similarly, the daily 61.8% fib level is at 1.3476, expected to provide resistance.
Note the levels of interest below:
- Pivot support is noted at 1.3317, 1.3259, 1.3146
- Pivot resistance is noted at 1.3487, 1.3599, 1.3657
| Levels | Levels.1 |
|---|---|
| Previous Daily High | 1.3542 |
| Previous Daily Low | 1.3371 |
| Previous Weekly High | 1.3639 |
| Previous Weekly Low | 1.3371 |
| Previous Monthly High | 1.3668 |
| Previous Monthly Low | 1.3301 |
| Daily Fibonacci 38.2% | 1.3436 |
| Daily Fibonacci 61.8% | 1.3476 |
| Daily Pivot Point S1 | 1.3317 |
| Daily Pivot Point S2 | 1.3259 |
| Daily Pivot Point S3 | 1.3146 |
| Daily Pivot Point R1 | 1.3487 |
| Daily Pivot Point R2 | 1.3599 |
| Daily Pivot Point R3 | 1.3657 |
[/s2If]
Nehcap Expert Advisor
The NEHCAP MT4 EA is high quality professional trading system geared to generate returns without using GRID or martingales. Each trade has strict risk per trade parameter. The pairs under management include EURUSD, GBPUSD, AUDCAD, AUDNZD,GBPAUD, EURAUD, EURCAD, CHFJPY and many more.
The system is trading live: LIVE ACCOUNT TRACKING
You can run it free. Apply for a free trial and track our account. Buy the system or use profit share mechanism to generate returns on your MT4.
Join Our Telegram Group
")


