Asian indices are showing mixed performance due to respective events. (Pivot Orderbook analysis)
…
This is a premium post.
[s2If !current_user_can(access_s2member_level4)]Please register for FREE REGISTER to read full post below containing analysis. In case of any error or you think you are not able to read the full post below, please email us at support#nehcap.com [lwa][/s2If] [s2If current_user_can(access_s2member_level1)]
- Asian indices are showing mixed performance due to respective events.
- Japanese stocks have faced selling pressure after the release of the dovish BoJ minutes.
- Chinese equities are demonstrating strength ahead of Trade Balance and inflation data.
The pair currently trades last at 29091.71.
The previous day high was 29131.88 while the previous day low was 28621.92. The daily 38.2% Fib levels comes at 28937.08, expected to provide support. Similarly, the daily 61.8% fib level is at 28816.72, expected to provide support.
Markets in the Asian domain are showing mixed performance as Nikkei 225 has faced a sell-off while Chinese stocks are sky-rocketing ahead of respective economic events. S&P500 futures are showing some losses in the Asian session amid uncertainty over US President Joe Biden’s meeting with Republicans for US debt ceiling issues. However, US equities were on the seventh cloud on Friday after the release of a modest increment in Nonfarm Payrolls (NFP) data.
At the press time, Japan’s Nikkei225 dropped 0.68%, ChinaA50 jumped 0.90%, Hang Seng climbed 0.92%, and Nifty50 gained 0.74%.
An unimpressive US NFP report has strengthened the expression that the Federal Reserve (Fed) will keep the interest rate policy steady in its June monetary policy meeting.
Japanese stocks have faced selling pressure despite the upbeat market mood. Nikkei 225 has failed to ride along with broader strength amid the release of the Bank of Japan (BoJ) minutes of April’s monetary policy meeting. BoJ members supported the continuation of policy easing in order to achieve steady inflation. While discussing an exit from the ultra-dovish policy, BoJ members conveyed that the central bank should consider the weight of risk associated with the policy shift stance before consideration.
Meanwhile, Chinese stocks are showing strength ahead of Trade Balance and Consumer Price Index (CPI) data. Annual exports are expected to decline as Western nations are supporting the China+1 policy. Financial Times reported that the European Union is planning sanctions on Chinese firms for supporting Russia’s war on Ukraine
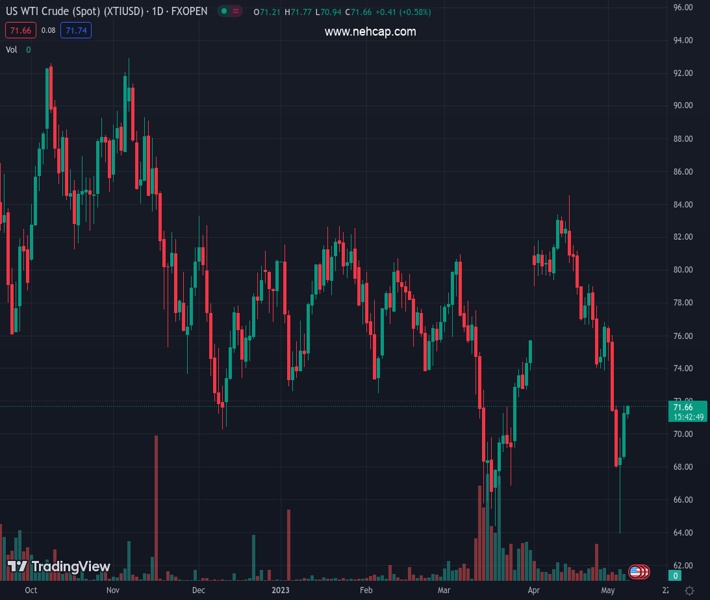
On the oil front, oil prices are eyeing a fresh rally above the immediate resistance of $71.80 on hopes that the Federal Reserve (Fed) will also pause its policy-tightening spell to avoid further damage to US economic outlook.
Technical Levels: Supports and Resistances
XTIUSD currently trading at 29091.71 at the time of writing. Pair opened at 29091.71 and is trading with a change of 0.0 % .
| Overview | Overview.1 | |
|---|---|---|
| 0 | Today last price | 29091.71 |
| 1 | Today Daily Change | 0.00 |
| 2 | Today Daily Change % | 0.00 |
| 3 | Today daily open | 29091.71 |
The pair remains strongly bullish on the daily timeframe. It trades above its 20 SMA @ 28565.24, 50 SMA 28041.01, 100 SMA @ 27457.83 and 200 SMA @ 27580.73.
| Trends | Trends.1 | |
|---|---|---|
| 0 | Daily SMA20 | 28565.24 |
| 1 | Daily SMA50 | 28041.01 |
| 2 | Daily SMA100 | 27457.83 |
| 3 | Daily SMA200 | 27580.73 |
The previous day high was 29131.88 while the previous day low was 28621.92. The daily 38.2% Fib levels comes at 28937.08, expected to provide support. Similarly, the daily 61.8% fib level is at 28816.72, expected to provide support.
Note the levels of interest below:
- Pivot support is noted at 28765.13, 28438.54, 28255.17
- Pivot resistance is noted at 29275.09, 29458.46, 29785.05
| Levels | Levels.1 |
|---|---|
| Previous Daily High | 29131.88 |
| Previous Daily Low | 28621.92 |
| Previous Weekly High | 29284.92 |
| Previous Weekly Low | 28544.43 |
| Previous Monthly High | 29058.52 |
| Previous Monthly Low | 27562.51 |
| Daily Fibonacci 38.2% | 28937.08 |
| Daily Fibonacci 61.8% | 28816.72 |
| Daily Pivot Point S1 | 28765.13 |
| Daily Pivot Point S2 | 28438.54 |
| Daily Pivot Point S3 | 28255.17 |
| Daily Pivot Point R1 | 29275.09 |
| Daily Pivot Point R2 | 29458.46 |
| Daily Pivot Point R3 | 29785.05 |
[/s2If]
Nehcap Expert Advisor
The NEHCAP MT4 EA is high quality professional trading system geared to generate returns without using GRID or martingales. Each trade has strict risk per trade parameter. The pairs under management include EURUSD, GBPUSD, AUDCAD, AUDNZD,GBPAUD, EURAUD, EURCAD, CHFJPY and many more.
The system is trading live: LIVE ACCOUNT TRACKING
You can run it free. Apply for a free trial and track our account. Buy the system or use profit share mechanism to generate returns on your MT4.
Join Our Telegram Group
")


