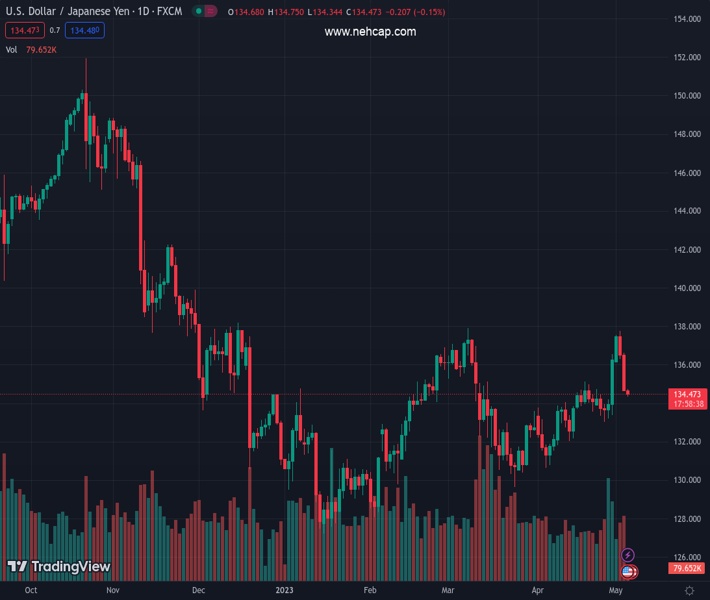
#USDJPY @ 134.493 prods short-term key support confluence during three-day downtrend, stays pressured at weekly low., @nehcap view: Corrective bounce expected (Pivot Orderbook analysis)
…
This is a premium post.
[s2If !current_user_can(access_s2member_level4)]Please register for FREE REGISTER to read full post below containing analysis. In case of any error or you think you are not able to read the full post below, please email us at support#nehcap.com [lwa][/s2If] [s2If current_user_can(access_s2member_level1)]
- USD/JPY prods short-term key support confluence during three-day downtrend, stays pressured at weekly low.
- 21-day EMA, five-week-old ascending trend line restricts immediate downside.
- Convergence of 50-day EMA, 200-day EMA, appears a tough nut to crack for Yen pair sellers.
- Bulls need validation from 135.25 to convince short-term buyers.
The pair currently trades last at 134.493.
The previous day high was 136.63 while the previous day low was 134.69. The daily 38.2% Fib levels comes at 135.43, expected to provide resistance. Similarly, the daily 61.8% fib level is at 135.89, expected to provide resistance.
USD/JPY holds lower ground near the weekly bottom surrounding 134.50 during early Thursday. In doing so, the Yen pair drops for the third consecutive day while proding the 21-day Exponential Moving Average (EMA) and an upward-sloping support line from March 24, near 134.40-50.
It’s worth noting that the Yen pair’s repeated failures to provide a daily closing beyond 138.00 join the pair’s pullback moves that broke the previous support zone around 135.25-15, comprising levels marked since mid-February, to keep the USD/JPY bears hopeful.
On the same line, the looming bear cross on the MACD adds strength to the downside bias.
However, the 21-day EMA and a five-week-old ascending support line prod the Yen pair sellers near 134.50-40 support confluence.
Following that, a convergence of the 50-day EMA and 200-day EMA, near 133.85, will be key to watch for the USD/JPY pair as it holds the gate for the bear’s welcome.
Meanwhile, USD/JPY buyers need validation from the immediate multi-day resistance zone of around 135.15-25 to convince short-term bulls.
Even so, multiple hurdles near 136.70, the 137.00 round figure and the 138.00 threshold can prod the USD/JPY buyers afterward before giving them control.
Trend: Corrective bounce expected
Technical Levels: Supports and Resistances
USDJPY currently trading at 134.47 at the time of writing. Pair opened at 134.7 and is trading with a change of -0.17% % .
| Overview | Overview.1 | |
|---|---|---|
| 0 | Today last price | 134.47 |
| 1 | Today Daily Change | -0.23 |
| 2 | Today Daily Change % | -0.17% |
| 3 | Today daily open | 134.7 |
The pair is trading above its 20 Daily moving average @ 134.16, above its 50 Daily moving average @ 133.92 , above its 100 Daily moving average @ 132.89 and below its 200 Daily moving average @ 136.98
| Trends | Trends.1 | |
|---|---|---|
| 0 | Daily SMA20 | 134.16 |
| 1 | Daily SMA50 | 133.92 |
| 2 | Daily SMA100 | 132.89 |
| 3 | Daily SMA200 | 136.98 |
The previous day high was 136.63 while the previous day low was 134.69. The daily 38.2% Fib levels comes at 135.43, expected to provide resistance. Similarly, the daily 61.8% fib level is at 135.89, expected to provide resistance.
Note the levels of interest below:
- Pivot support is noted at 134.05, 133.4, 132.11
- Pivot resistance is noted at 135.99, 137.28, 137.93
| Levels | Levels.1 |
|---|---|
| Previous Daily High | 136.63 |
| Previous Daily Low | 134.69 |
| Previous Weekly High | 136.56 |
| Previous Weekly Low | 133.01 |
| Previous Monthly High | 136.56 |
| Previous Monthly Low | 130.63 |
| Daily Fibonacci 38.2% | 135.43 |
| Daily Fibonacci 61.8% | 135.89 |
| Daily Pivot Point S1 | 134.05 |
| Daily Pivot Point S2 | 133.40 |
| Daily Pivot Point S3 | 132.11 |
| Daily Pivot Point R1 | 135.99 |
| Daily Pivot Point R2 | 137.28 |
| Daily Pivot Point R3 | 137.93 |
[/s2If]
Nehcap Expert Advisor
The NEHCAP MT4 EA is high quality professional trading system geared to generate returns without using GRID or martingales. Each trade has strict risk per trade parameter. The pairs under management include EURUSD, GBPUSD, AUDCAD, AUDNZD,GBPAUD, EURAUD, EURCAD, CHFJPY and many more.
The system is trading live: LIVE ACCOUNT TRACKING
You can run it free. Apply for a free trial and track our account. Buy the system or use profit share mechanism to generate returns on your MT4.
Join Our Telegram Group
")


