#USDCHF @ 0.88286 has faced an intense sell-off as the Fed delivered neutral interest rate guidance. (Pivot Orderbook analysis)
…
This is a premium post.
[s2If !current_user_can(access_s2member_level4)]Please register for FREE REGISTER to read full post below containing analysis. In case of any error or you think you are not able to read the full post below, please email us at support#nehcap.com [lwa][/s2If] [s2If current_user_can(access_s2member_level1)]
- USD/CHF has faced an intense sell-off as the Fed delivered neutral interest rate guidance.
- The USD Index looks vulnerable above 101.07 as fears of the US debt ceiling issue are accelerating swiftly.
- US Treasury has already conveyed that it will be out of funds by early June.
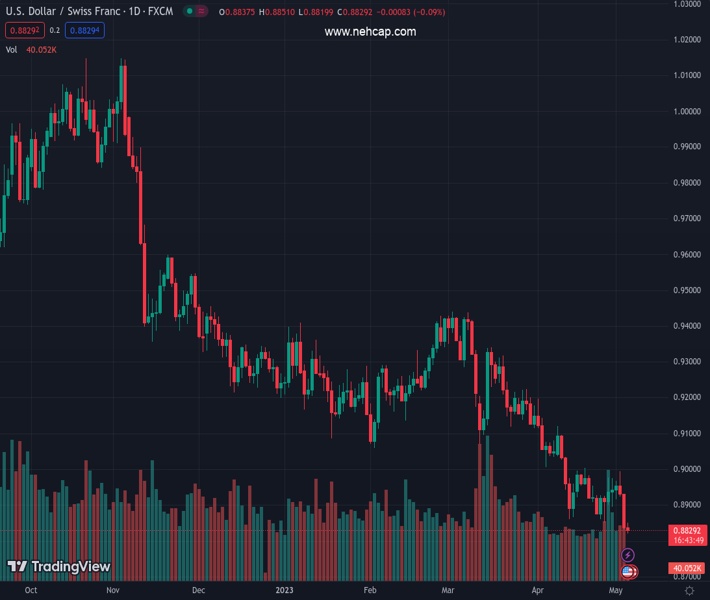
The pair currently trades last at 0.88286.
The previous day high was 0.8932 while the previous day low was 0.8833. The daily 38.2% Fib levels comes at 0.8871, expected to provide resistance. Similarly, the daily 61.8% fib level is at 0.8894, expected to provide resistance.
The USD/CHF pair witnessed massive offers from investors on Wednesday as the Federal Reserve (Fed) delivered neutral guidance after hiking interest rates by 25 basis points (bps) to 5.00-5.25%. The Swiss Franc asset has refreshed its two-year low at 0.8820 and is expected to display more downside as the US Dollar Index (DXY) is failing to show evidence of getting confident support.
The USD Index looks vulnerable above its crucial support of 101.07 as fears of the US debt ceiling issue are accelerating swiftly. The White House is not ready for negotiations over the cost of the President’s spending initiatives. US Treasury has already conveyed that it will be out of funds by early June, which would cost 8.3 million jobs and a 6.1% reduction in economic output reported by the White House Council of Economic Advisors.
Meanwhile, S&P500 futures have recovered their entire losses and has turned positive, portraying a recovery in the risk appetite of investors.
USD/CHF is declining towards the crucial support plotted horizontally from 08 January 2021 low at 0.8758. The supply area for US Dollar bulls is placed in a range of 0.8984-0.9000 range on a weekly scale. The 10-period Exponential Moving Average (EMA) at 0.9041 is consistently acting as a barricade for the US Dollar bulls.
The Relative Strength Index (RSI) (14) is oscillating in the bearish range of 20.00-40.00, conveying that the downside momentum is extremely solid.
A breakdown of the intraday low at 0.8820 will drag the asset toward 01 January 201 low at 0.8794 followed by January 2021 low at 0.8758.
In an alternate scenario, a confident move above the psychological resistance at 0.9000, US Dollar bulls will drive the asset towards April 07 low and high at 0.9034 and 0.9082 respectively.
Technical Levels: Supports and Resistances
USDCHF currently trading at 0.8827 at the time of writing. Pair opened at 0.8838 and is trading with a change of -0.12 % .
| Overview | Overview.1 | |
|---|---|---|
| 0 | Today last price | 0.8827 |
| 1 | Today Daily Change | -0.0011 |
| 2 | Today Daily Change % | -0.1200 |
| 3 | Today daily open | 0.8838 |
The pair remains strongly bearish on the daily time frame. It trades below the 20 SMA @ 0.8955, 50 SMA 0.9136, 100 SMA @ 0.9192 and 200 SMA @ 0.9437.
| Trends | Trends.1 | |
|---|---|---|
| 0 | Daily SMA20 | 0.8955 |
| 1 | Daily SMA50 | 0.9136 |
| 2 | Daily SMA100 | 0.9192 |
| 3 | Daily SMA200 | 0.9437 |
The previous day high was 0.8932 while the previous day low was 0.8833. The daily 38.2% Fib levels comes at 0.8871, expected to provide resistance. Similarly, the daily 61.8% fib level is at 0.8894, expected to provide resistance.
Note the levels of interest below:
- Pivot support is noted at 0.8803, 0.8769, 0.8704
- Pivot resistance is noted at 0.8902, 0.8967, 0.9001
| Levels | Levels.1 |
|---|---|
| Previous Daily High | 0.8932 |
| Previous Daily Low | 0.8833 |
| Previous Weekly High | 0.8976 |
| Previous Weekly Low | 0.8852 |
| Previous Monthly High | 0.9198 |
| Previous Monthly Low | 0.8852 |
| Daily Fibonacci 38.2% | 0.8871 |
| Daily Fibonacci 61.8% | 0.8894 |
| Daily Pivot Point S1 | 0.8803 |
| Daily Pivot Point S2 | 0.8769 |
| Daily Pivot Point S3 | 0.8704 |
| Daily Pivot Point R1 | 0.8902 |
| Daily Pivot Point R2 | 0.8967 |
| Daily Pivot Point R3 | 0.9001 |
[/s2If]
Nehcap Expert Advisor
The NEHCAP MT4 EA is high quality professional trading system geared to generate returns without using GRID or martingales. Each trade has strict risk per trade parameter. The pairs under management include EURUSD, GBPUSD, AUDCAD, AUDNZD,GBPAUD, EURAUD, EURCAD, CHFJPY and many more.
The system is trading live: LIVE ACCOUNT TRACKING
You can run it free. Apply for a free trial and track our account. Buy the system or use profit share mechanism to generate returns on your MT4.
Join Our Telegram Group
")


