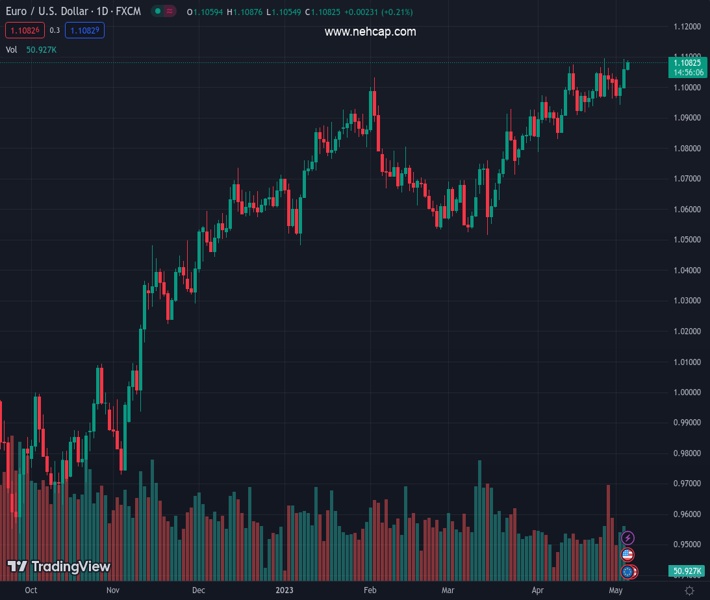
#EURUSD @ 1.10826 is marching towards 1.1100 as the USD Index is facing multiple headwinds. (Pivot Orderbook analysis)
…
This is a premium post.
[s2If !current_user_can(access_s2member_level4)]Please register for FREE REGISTER to read full post below containing analysis. In case of any error or you think you are not able to read the full post below, please email us at support#nehcap.com [lwa][/s2If] [s2If current_user_can(access_s2member_level1)]
- EUR/USD is marching towards 1.1100 as the USD Index is facing multiple headwinds.
- Federal Reserve has changed its policy stance guidance to neutral after hiking rates consecutively by 25 bps to 5.00-5.25%.
- A decline in credit disposal from European banks could force the European Central Bank to announce a smaller rate hike.
- EUR/USD is on the verge of delivering a breakout of the Ascending Triangle.
The pair currently trades last at 1.10826.
The previous day high was 1.1092 while the previous day low was 1.1. The daily 38.2% Fib levels comes at 1.1057, expected to provide support. Similarly, the daily 61.8% fib level is at 1.1035, expected to provide support.
EUR/USD has shifted its auction comfortably above the critical resistance of 1.0800 in the early European session. The major currency pair is expected to extend its upside journey towards the round-level resistance of 1.1100 as the Federal Reserve (Fed) has changed its policy stance guidance to neutral after hiking rates consecutively by 25 basis points (bps) to 5.00-5.25%. However, the road to reaching the terminal rate for the European Central Bank (ECB) is far from over.
S&P500 futures have added decent gains in the Asian session, portraying a meaningful recovery in the risk appetite of investors. US equities were heavily dumped by investors on Wednesday amid uncertainty over the Fed’s roadmap of arresting sticky inflation. Also, a bloodbath in PacWest Bancorp renewed fears of a US banking crisis. Bloomberg reported that PacWest Bancorp is considering strategic options, including a potential sale.
The US Dollar Index (DXY) is defending the immediate support of 101.07, however, the absence of recovery signs is strengthening the downside bias. Federal Reserve’s change of language to ‘monetary action will be data dependent’ from ‘some appropriate tightening would be required’ has trimmed expectations of further policy-tightening dramatically.
There is no denying the fact that a shift in policy stance by the Federal Reserve has weighed heavily on the US Dollar. It is highly anticipated that the policy-tightening spell by the Federal Reserve is paused for now considering the mounting banking crisis and deepening fears of a US recession.
Apart from that, catalysts that have capped the upside in the USD Index are renewed US banking woes and debt ceiling concerns.
A few days back, US President Joe Biden denied negotiations on raising the US debt ceiling with Republicans as they were supporting it at the cost of the President’s spending initiatives. The White House is not ready to make negotiations, however, repercussions of delay in US debt ceiling talks are haunting the USD Index.
US Treasury has already confirmed that it will run out of funds in early June, which would result in a default on payment obligations. According to an analysis by the White House Council of Economic Advisers, a protracted default on U.S. payment obligations could result in the loss of 8.3 million jobs and a 6.1% reduction in economic output, as reported by Reuters.
To avoid such circumstances, the White House could come sooner on the table for negotiations otherwise it would cost severe damage to the US economy.
The street is awaiting the announcement of the interest rate decision by the European Central Bank to understand how swift policymakers are looking to tame stubborn Eurozone inflation. Investors are divided over the pace of the interest rate hike as the growth rate in the Eurozone economy has squeezed sharply. Reuters reported that a decline in credit disposal from European banks and softening inflation is bolstering the case of a smaller interest rate hike announcement from European Central Bank President Christine Lagarde. However, European Central Bank Governing Council Member Isabel Schnabel said last week that a 50 bps interest rate hike is on the cards.
EUR/USD is on the verge of delivering a breakout of the Ascending Triangle chart pattern formed on a four-hour scale. The upward-sloping trendline of the chart pattern is plotted from April 17 low at 1.0910 while the horizontal resistance is placed from April 14 high at 1.1076.
Advancing 10-period Exponential Moving Average (EMA) at 1.1050 is diverged from the shared currency pair, indicating a sheer strength in the Euro bulls.
The Relative Strength Index has shifted into the bullish range of 60.00-80.00, which conveys that more gains are in the pipeline.
Technical Levels: Supports and Resistances
EURUSD currently trading at 1.1084 at the time of writing. Pair opened at 1.106 and is trading with a change of 0.22 % .
| Overview | Overview.1 | |
|---|---|---|
| 0 | Today last price | 1.1084 |
| 1 | Today Daily Change | 0.0024 |
| 2 | Today Daily Change % | 0.2200 |
| 3 | Today daily open | 1.1060 |
The pair remains strongly bullish on the daily timeframe. It trades above its 20 SMA @ 1.0979, 50 SMA 1.0821, 100 SMA @ 1.0774 and 200 SMA @ 1.0426.
| Trends | Trends.1 | |
|---|---|---|
| 0 | Daily SMA20 | 1.0979 |
| 1 | Daily SMA50 | 1.0821 |
| 2 | Daily SMA100 | 1.0774 |
| 3 | Daily SMA200 | 1.0426 |
The previous day high was 1.1092 while the previous day low was 1.1. The daily 38.2% Fib levels comes at 1.1057, expected to provide support. Similarly, the daily 61.8% fib level is at 1.1035, expected to provide support.
Note the levels of interest below:
- Pivot support is noted at 1.101, 1.096, 1.0919
- Pivot resistance is noted at 1.1101, 1.1142, 1.1192
| Levels | Levels.1 |
|---|---|
| Previous Daily High | 1.1092 |
| Previous Daily Low | 1.1000 |
| Previous Weekly High | 1.1095 |
| Previous Weekly Low | 1.0962 |
| Previous Monthly High | 1.1095 |
| Previous Monthly Low | 1.0788 |
| Daily Fibonacci 38.2% | 1.1057 |
| Daily Fibonacci 61.8% | 1.1035 |
| Daily Pivot Point S1 | 1.1010 |
| Daily Pivot Point S2 | 1.0960 |
| Daily Pivot Point S3 | 1.0919 |
| Daily Pivot Point R1 | 1.1101 |
| Daily Pivot Point R2 | 1.1142 |
| Daily Pivot Point R3 | 1.1192 |
[/s2If]
Nehcap Expert Advisor
The NEHCAP MT4 EA is high quality professional trading system geared to generate returns without using GRID or martingales. Each trade has strict risk per trade parameter. The pairs under management include EURUSD, GBPUSD, AUDCAD, AUDNZD,GBPAUD, EURAUD, EURCAD, CHFJPY and many more.
The system is trading live: LIVE ACCOUNT TRACKING
You can run it free. Apply for a free trial and track our account. Buy the system or use profit share mechanism to generate returns on your MT4.
Join Our Telegram Group
")


