#EURUSD @ 1.10757 ’s upside falters just ahead of 1.1100 once again. (Pivot Orderbook analysis)
…
This is a premium post.
[s2If !current_user_can(access_s2member_level4)]Please register for FREE REGISTER to read full post below containing analysis. In case of any error or you think you are not able to read the full post below, please email us at support#nehcap.com [lwa][/s2If] [s2If current_user_can(access_s2member_level1)]
- EUR/USD’s upside falters just ahead of 1.1100 once again.
- A sustainable advance seems likely once 1.1100 is cleared.
The pair currently trades last at 1.10757.
The previous day high was 1.1092 while the previous day low was 1.1. The daily 38.2% Fib levels comes at 1.1057, expected to provide support. Similarly, the daily 61.8% fib level is at 1.1035, expected to provide support.
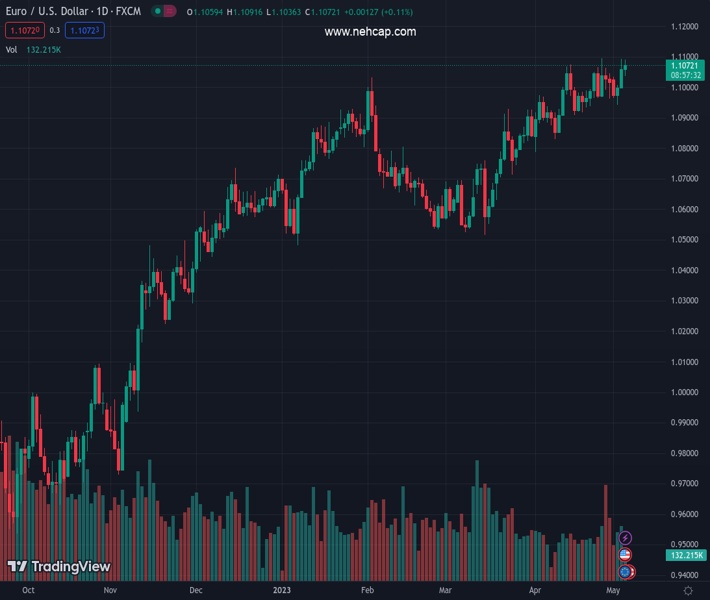
EUR/USD keeps the march north well in place and always with the immediate target at the 1.1100 barrier so far on Thursday.
Further recovery appears on the table for the time being. The surpass of with the 2023 high at 1.1095 (April 26) should encourage the pair to rapidly leave behind the round level at 1.1100 before embarking on a potential visit to the weekly high at 1.1184 (March 21 2022)
Looking at the longer run, the constructive view remains unchanged while above the 200-day SMA, today at 1.0429.
Technical Levels: Supports and Resistances
EURUSD currently trading at 1.1067 at the time of writing. Pair opened at 1.106 and is trading with a change of 0.06 % .
| Overview | Overview.1 | |
|---|---|---|
| 0 | Today last price | 1.1067 |
| 1 | Today Daily Change | 55.0000 |
| 2 | Today Daily Change % | 0.0600 |
| 3 | Today daily open | 1.1060 |
The pair remains strongly bullish on the daily timeframe. It trades above its 20 SMA @ 1.0979, 50 SMA 1.0821, 100 SMA @ 1.0774 and 200 SMA @ 1.0426.
| Trends | Trends.1 | |
|---|---|---|
| 0 | Daily SMA20 | 1.0979 |
| 1 | Daily SMA50 | 1.0821 |
| 2 | Daily SMA100 | 1.0774 |
| 3 | Daily SMA200 | 1.0426 |
The previous day high was 1.1092 while the previous day low was 1.1. The daily 38.2% Fib levels comes at 1.1057, expected to provide support. Similarly, the daily 61.8% fib level is at 1.1035, expected to provide support.
Note the levels of interest below:
- Pivot support is noted at 1.101, 1.096, 1.0919
- Pivot resistance is noted at 1.1101, 1.1142, 1.1192
| Levels | Levels.1 |
|---|---|
| Previous Daily High | 1.1092 |
| Previous Daily Low | 1.1000 |
| Previous Weekly High | 1.1095 |
| Previous Weekly Low | 1.0962 |
| Previous Monthly High | 1.1095 |
| Previous Monthly Low | 1.0788 |
| Daily Fibonacci 38.2% | 1.1057 |
| Daily Fibonacci 61.8% | 1.1035 |
| Daily Pivot Point S1 | 1.1010 |
| Daily Pivot Point S2 | 1.0960 |
| Daily Pivot Point S3 | 1.0919 |
| Daily Pivot Point R1 | 1.1101 |
| Daily Pivot Point R2 | 1.1142 |
| Daily Pivot Point R3 | 1.1192 |
[/s2If]
Nehcap Expert Advisor
The NEHCAP MT4 EA is high quality professional trading system geared to generate returns without using GRID or martingales. Each trade has strict risk per trade parameter. The pairs under management include EURUSD, GBPUSD, AUDCAD, AUDNZD,GBPAUD, EURAUD, EURCAD, CHFJPY and many more.
The system is trading live: LIVE ACCOUNT TRACKING
You can run it free. Apply for a free trial and track our account. Buy the system or use profit share mechanism to generate returns on your MT4.
Join Our Telegram Group
")


