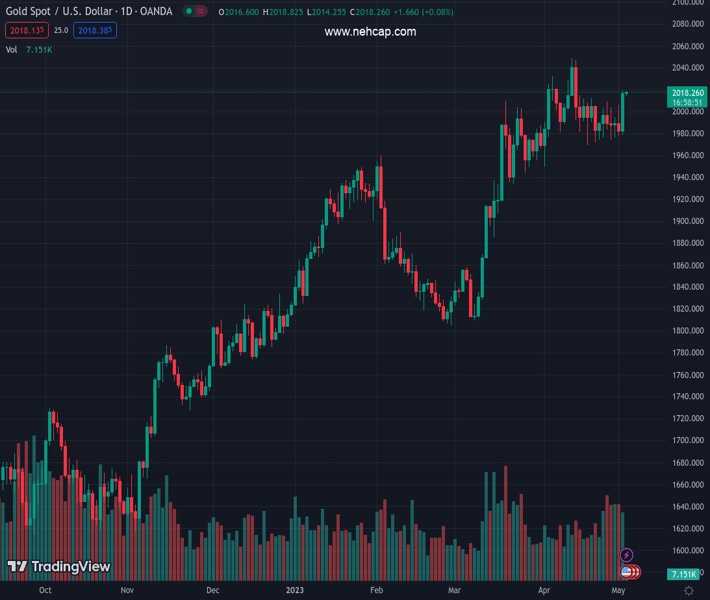
#XAUUSD @ 2,018.47 Gold price is aiming to surpass $2,020.00 as its appeal has improved amid US debt ceiling concerns. (Pivot Orderbook analysis)
…
This is a premium post.
[s2If !current_user_can(access_s2member_level4)]Please register for FREE REGISTER to read full post below containing analysis. In case of any error or you think you are not able to read the full post below, please email us at support#nehcap.com [lwa][/s2If] [s2If current_user_can(access_s2member_level1)]
- Gold price is aiming to surpass $2,020.00 as its appeal has improved amid US debt ceiling concerns.
- An extension in the US debt ceiling would result in a downgrade of the US long-term outlook.
- Gold price is marching towards $2,048.75 after a symmetrical triangle breakout.
The pair currently trades last at 2018.47.
The previous day high was 2019.43 while the previous day low was 1978.51. The daily 38.2% Fib levels comes at 2003.8, expected to provide support. Similarly, the daily 61.8% fib level is at 1994.14, expected to provide support.
Gold price (XAU/USD) is gathering strength for a breakout above the immediate resistance of $2,020.00 in the Asian session. The precious metal has shifted into a bullish trajectory as concerns for the United States are mounting. After the headlines from US Treasury Secretary Janet Yellen that the Treasury will run out of funds in early June if the administration fails to raise the debt ceiling and will face problems in making payments.
US President Joe Biden is declining negotiations with US House of Senate Joseph McCarthy as Republicans want big cuts in President’s spending initiatives. However, concerns that the US economy won’t be able to make payments smoothly would force US Biden to come to the table for debt ceiling talks.
An extension in the US debt ceiling would result in a downgrade of the US long-term outlook, which would have a negative impact on the US Dollar, Treasury yields, and S&P500. However, the appeal of the Gold price will improve further as safe-haven.
Meanwhile, S&P500 futures have added moderate gains in Asia, showing signs of improvement in the risk appetite. However, the overall market mood is still risk-off. The US Dollar Index (DXY) has dropped sharply to near 101.72 and is expected to extend its downside to near 101.63 ahead of the Federal Reserve (Fed) policy.
A consecutive 25 basis points (bps) interest rate hike from Fed chair Jerome Powell is expected to be followed by neutral guidance as US labor market conditions are easing and manufacturing activities are consistently contracting.
Gold price delivered a breakout of the Symmetrical Triangle chart pattern formed on a four-hour scale, which results in wider ticks and heavy volume. The yellow metal is marching towards the horizontal resistance plotted from April 13 high at $2,048.75.
Advancing 20-period Exponential Moving Average (EMA) at $1,996.47 will provide support to the Gold bulls.
The Relative Strength Index (RSI) (14) has climbed above 60.00 indicating that the upside momentum is active now.
Technical Levels: Supports and Resistances
XAUUSD currently trading at 2017.8 at the time of writing. Pair opened at 2016.67 and is trading with a change of 0.06 % .
| Overview | Overview.1 | |
|---|---|---|
| 0 | Today last price | 2017.80 |
| 1 | Today Daily Change | 1.13 |
| 2 | Today Daily Change % | 0.06 |
| 3 | Today daily open | 2016.67 |
The pair remains strongly bullish on the daily timeframe. It trades above its 20 SMA @ 2001.95, 50 SMA 1940.31, 100 SMA @ 1901.75 and 200 SMA @ 1810.17.
| Trends | Trends.1 | |
|---|---|---|
| 0 | Daily SMA20 | 2001.95 |
| 1 | Daily SMA50 | 1940.31 |
| 2 | Daily SMA100 | 1901.75 |
| 3 | Daily SMA200 | 1810.17 |
The previous day high was 2019.43 while the previous day low was 1978.51. The daily 38.2% Fib levels comes at 2003.8, expected to provide support. Similarly, the daily 61.8% fib level is at 1994.14, expected to provide support.
Note the levels of interest below:
- Pivot support is noted at 1990.31, 1963.95, 1949.39
- Pivot resistance is noted at 2031.23, 2045.79, 2072.15
| Levels | Levels.1 |
|---|---|
| Previous Daily High | 2019.43 |
| Previous Daily Low | 1978.51 |
| Previous Weekly High | 2009.41 |
| Previous Weekly Low | 1974.13 |
| Previous Monthly High | 2048.75 |
| Previous Monthly Low | 1949.83 |
| Daily Fibonacci 38.2% | 2003.80 |
| Daily Fibonacci 61.8% | 1994.14 |
| Daily Pivot Point S1 | 1990.31 |
| Daily Pivot Point S2 | 1963.95 |
| Daily Pivot Point S3 | 1949.39 |
| Daily Pivot Point R1 | 2031.23 |
| Daily Pivot Point R2 | 2045.79 |
| Daily Pivot Point R3 | 2072.15 |
[/s2If]
Nehcap Expert Advisor
The NEHCAP MT4 EA is high quality professional trading system geared to generate returns without using GRID or martingales. Each trade has strict risk per trade parameter. The pairs under management include EURUSD, GBPUSD, AUDCAD, AUDNZD,GBPAUD, EURAUD, EURCAD, CHFJPY and many more.
The system is trading live: LIVE ACCOUNT TRACKING
You can run it free. Apply for a free trial and track our account. Buy the system or use profit share mechanism to generate returns on your MT4.
Join Our Telegram Group
")


