WTI crude oil treads water after positing the biggest daily loss in eight months. (Pivot Orderbook analysis)
…
This is a premium post.
[s2If !current_user_can(access_s2member_level4)]Please register for FREE REGISTER to read full post below containing analysis. In case of any error or you think you are not able to read the full post below, please email us at support#nehcap.com [lwa][/s2If] [s2If current_user_can(access_s2member_level1)]
- WTI crude oil treads water after positing the biggest daily loss in eight months.
- Mixed plays between anticipated rate hikes and China-led optimism prod Oil traders amid pre-Fed anxiety.
- API inventories, hawkish Fed bets keep energy bears hopeful ahead of WTI crude oil stockpile, FOMC.
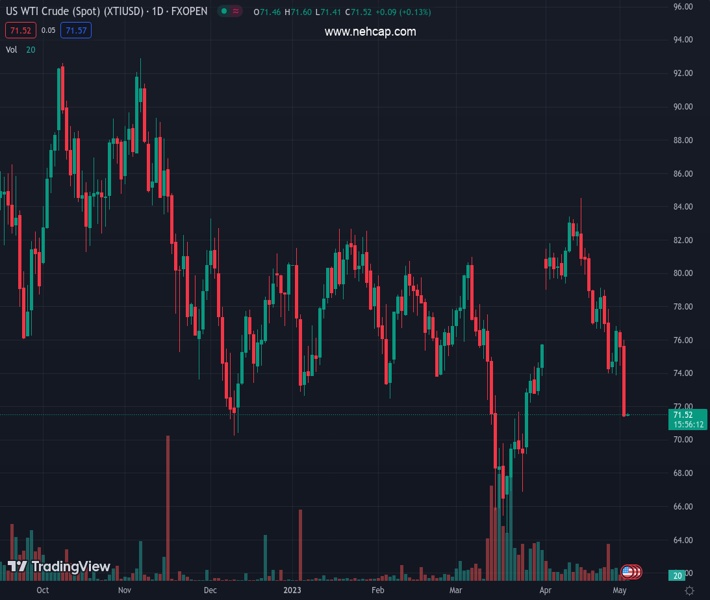
The pair currently trades last at 71.52.
The previous day high was 76.03 while the previous day low was 71.37. The daily 38.2% Fib levels comes at 73.15, expected to provide resistance. Similarly, the daily 61.8% fib level is at 74.25, expected to provide resistance.
WTI crude oil stays depressed at the lowest levels since late March, poked the previous day, as energy bearish make rounds to $71.50 during early Wednesday in Europe. In doing so, the black gold price takes clues from the dicey markets ahead of the Federal Open Market Committee (FOMC) monetary policy meeting announcements.
Apart from the pre-Fed anxiety, mixed plays between the hopes of more demand from China and fears of higher rates, as well as banking woes, also exert downside pressure on the black gold prices. On the same line could be the weekly Oil inventories per the industry report. That said, the American Petroleum Institute (API) said that the Weekly Crude Oil Stock declined by -3.939M during the week ended on April 28 versus -6.083M prior.
It’s worth noting that the International Monetary Fund (IMF) raised economic forecasts of the Asia-Pacific zone in its latest report while also adding, “Asia and Pacific will be the most dynamic of the world’s major regions in 2023, predominantly driven by the buoyant outlook for China and India.”
On the other hand, recently upbeat inflation signals from the US keep the Fed hawks hopeful even as the White House blames the US central bank’s higher rates for banking fallouts. Late Tuesday, a top White House (WH) Economist Heather Boushey, a member of the White House Council of Economic Advisers, told Reuters that the Fed is raising interest rates in the hope of reducing inflation. That is having this negative effect on the banking sector. “Why would we add to that?,” said WH Economist Heather Boushey.
Elsewhere, chatters of no major output cuts from the OPEC+ group during 2023 and likely easing in supply crunch, due to heavy floating of Oil in Moscow, weighs on the Oil price.
On a different page, a Reuters survey found that OPEC oil output fell 190,000 barrels-per day in April, mainly driven by Iraq and Nigeria. Output is set to drop further in May as a new round of voluntary cuts unveiled on April 2 takes effect,” per the news.
Looking forward, weekly inventory data from the US Energy Information Administration (EIA), expected -1.0M versus -5.054M, will join the Fed’s announcements to direct intraday Oil prices move.
A clear downside break of an ascending trend line from March 17, now immediate resistance near $74.70, keeps WTI crude oil bears hopeful of breaking the $70.00 psychological magnet.
Technical Levels: Supports and Resistances
XTIUSD currently trading at 71.52 at the time of writing. Pair opened at 71.5 and is trading with a change of 0.03% % .
| Overview | Overview.1 | |
|---|---|---|
| 0 | Today last price | 71.52 |
| 1 | Today Daily Change | 0.02 |
| 2 | Today Daily Change % | 0.03% |
| 3 | Today daily open | 71.5 |
The pair remains strongly bearish on the daily time frame. It trades below the 20 SMA @ 78.78, 50 SMA 75.98, 100 SMA @ 77.02 and 200 SMA @ 81.39.
| Trends | Trends.1 | |
|---|---|---|
| 0 | Daily SMA20 | 78.78 |
| 1 | Daily SMA50 | 75.98 |
| 2 | Daily SMA100 | 77.02 |
| 3 | Daily SMA200 | 81.39 |
The previous day high was 76.03 while the previous day low was 71.37. The daily 38.2% Fib levels comes at 73.15, expected to provide resistance. Similarly, the daily 61.8% fib level is at 74.25, expected to provide resistance.
Note the levels of interest below:
- Pivot support is noted at 69.9, 68.3, 65.24
- Pivot resistance is noted at 74.56, 77.63, 79.22
| Levels | Levels.1 |
|---|---|
| Previous Daily High | 76.03 |
| Previous Daily Low | 71.37 |
| Previous Weekly High | 79.14 |
| Previous Weekly Low | 73.88 |
| Previous Monthly High | 83.40 |
| Previous Monthly Low | 73.88 |
| Daily Fibonacci 38.2% | 73.15 |
| Daily Fibonacci 61.8% | 74.25 |
| Daily Pivot Point S1 | 69.90 |
| Daily Pivot Point S2 | 68.30 |
| Daily Pivot Point S3 | 65.24 |
| Daily Pivot Point R1 | 74.56 |
| Daily Pivot Point R2 | 77.63 |
| Daily Pivot Point R3 | 79.22 |
[/s2If]
Nehcap Expert Advisor
The NEHCAP MT4 EA is high quality professional trading system geared to generate returns without using GRID or martingales. Each trade has strict risk per trade parameter. The pairs under management include EURUSD, GBPUSD, AUDCAD, AUDNZD,GBPAUD, EURAUD, EURCAD, CHFJPY and many more.
The system is trading live: LIVE ACCOUNT TRACKING
You can run it free. Apply for a free trial and track our account. Buy the system or use profit share mechanism to generate returns on your MT4.
Join Our Telegram Group
")


