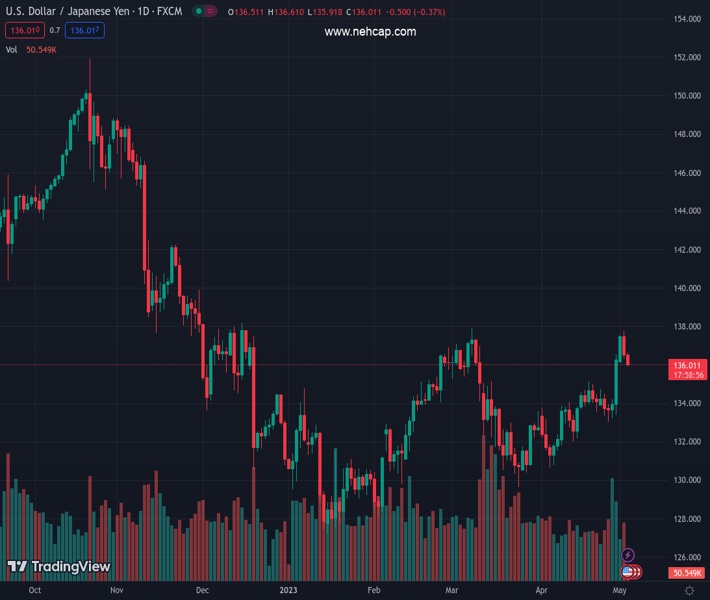
#USDJPY @ 136.043 takes offers to extend the previous day’s pullback from two-month high., @nehcap view: Further downside expected (Pivot Orderbook analysis)
…
This is a premium post.
[s2If !current_user_can(access_s2member_level4)]Please register for FREE REGISTER to read full post below containing analysis. In case of any error or you think you are not able to read the full post below, please email us at support#nehcap.com [lwa][/s2If] [s2If current_user_can(access_s2member_level1)]
- USD/JPY takes offers to extend the previous day’s pullback from two-month high.
- Bearish MACD signals, descending RSI (14) near 50.00 level keeps Yen pair bears hopeful.
- Previous resistance line from late March restricts immediate downside, 137.80-90 region appears a tough nut to crack for USD/JPY bulls.
The pair currently trades last at 136.043.
The previous day high was 137.78 while the previous day low was 136.31. The daily 38.2% Fib levels comes at 136.87, expected to provide resistance. Similarly, the daily 61.8% fib level is at 137.22, expected to provide resistance.
USD/JPY renews its intraday low near 136.00 as it extends the previous day’s U-turn from a multi-day high during early Wednesday. That said, the Yen pair keeps the earlier moves intact amid holidays in Japan and cautious mood ahead of the Federal Open Market Committee (FOMC) monetary policy meeting announcements.
Also read: FOMC Meeting Preview: Powell to keep every door open, surprises not out of the table after RBA
In doing so, the Yen pair stretches Tuesday’s U-turn from March’s peak, portraying a two-month-old horizontal resistance near 137.80-90, while justifying the bearish MACD signals. Adding strength to the downside bias is the descending RSI (14) line that currently seesaws near the 50.0 level, which in turn suggests the continuation of the latest weakness in the USD/JPY price.
However, the resistance-turned-support line from late March, around 135.70 at the latest, restricts the immediate downside of the USD/JPY pair.
Following that, multiple levels marked since March 10 and 50-SMA highlight the 135.15-135.00 area as the key support to break for the Yen pair sellers before taking control. Even so, a one-month-old ascending support line near 133.80 can act as the last defense of the USD/JPY buyers.
Meanwhile, USD/JPY pair’s recovery moves need to stabilize beyond the 137.00 immediate hurdle to convince intraday buyers. However, tops marked in March and May, around 137.80-90, quickly followed by the 138.00 round figure, could challenge the Yen pair bulls.
Trend: Further downside expected
Technical Levels: Supports and Resistances
USDJPY currently trading at 136.07 at the time of writing. Pair opened at 136.55 and is trading with a change of -0.35% % .
| Overview | Overview.1 | |
|---|---|---|
| 0 | Today last price | 136.07 |
| 1 | Today Daily Change | -0.48 |
| 2 | Today Daily Change % | -0.35% |
| 3 | Today daily open | 136.55 |
The pair is trading above its 20 Daily moving average @ 133.99, above its 50 Daily moving average @ 133.93 , above its 100 Daily moving average @ 132.89 and below its 200 Daily moving average @ 136.99
| Trends | Trends.1 | |
|---|---|---|
| 0 | Daily SMA20 | 133.99 |
| 1 | Daily SMA50 | 133.93 |
| 2 | Daily SMA100 | 132.89 |
| 3 | Daily SMA200 | 136.99 |
The previous day high was 137.78 while the previous day low was 136.31. The daily 38.2% Fib levels comes at 136.87, expected to provide resistance. Similarly, the daily 61.8% fib level is at 137.22, expected to provide resistance.
Note the levels of interest below:
- Pivot support is noted at 135.99, 135.42, 134.52
- Pivot resistance is noted at 137.45, 138.34, 138.91
| Levels | Levels.1 |
|---|---|
| Previous Daily High | 137.78 |
| Previous Daily Low | 136.31 |
| Previous Weekly High | 136.56 |
| Previous Weekly Low | 133.01 |
| Previous Monthly High | 136.56 |
| Previous Monthly Low | 130.63 |
| Daily Fibonacci 38.2% | 136.87 |
| Daily Fibonacci 61.8% | 137.22 |
| Daily Pivot Point S1 | 135.99 |
| Daily Pivot Point S2 | 135.42 |
| Daily Pivot Point S3 | 134.52 |
| Daily Pivot Point R1 | 137.45 |
| Daily Pivot Point R2 | 138.34 |
| Daily Pivot Point R3 | 138.91 |
[/s2If]
Nehcap Expert Advisor
The NEHCAP MT4 EA is high quality professional trading system geared to generate returns without using GRID or martingales. Each trade has strict risk per trade parameter. The pairs under management include EURUSD, GBPUSD, AUDCAD, AUDNZD,GBPAUD, EURAUD, EURCAD, CHFJPY and many more.
The system is trading live: LIVE ACCOUNT TRACKING
You can run it free. Apply for a free trial and track our account. Buy the system or use profit share mechanism to generate returns on your MT4.
Join Our Telegram Group
")


