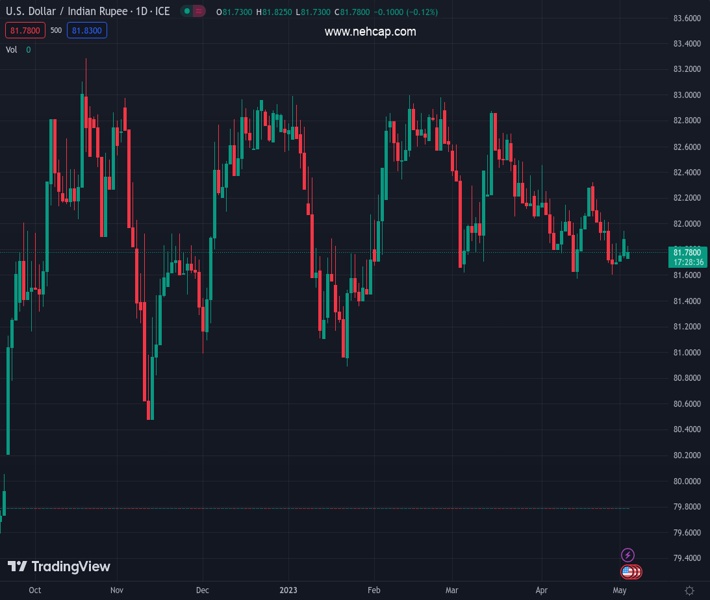
#USDINR @ 81.7900 is confidently defending its immediate support of 81.70 despite a weak USD Index and a nosedive move in the oil price. (Pivot Orderbook analysis)
…
This is a premium post.
[s2If !current_user_can(access_s2member_level4)]Please register for FREE REGISTER to read full post below containing analysis. In case of any error or you think you are not able to read the full post below, please email us at support#nehcap.com [lwa][/s2If] [s2If current_user_can(access_s2member_level1)]
- USD/INR is confidently defending its immediate support of 81.70 despite a weak USD Index and a nosedive move in the oil price.
- A minor recovery in the S&P500 futures could be a dead cat bounce move as US equities were heavily beaten on Tuesday.
- Rising concerns over the US debt ceiling have heavily weighed on Treasury yields.
The pair currently trades last at 81.7900.
The previous day high was 81.9525 while the previous day low was 81.6934. The daily 38.2% Fib levels comes at 81.8535, expected to provide resistance. Similarly, the daily 61.8% fib level is at 81.7924, expected to provide resistance.
The USD/INR pair has rebounded after dropping to near 81.70 in the Asian session. The major has defended its downside despite weakness in the US Dollar Index (DXY) amid debt ceiling woes and a bloodbath in the oil price.
S&P500 futures have added some gains in Asia, which could be a dead cat bounce move as US equities were heavily beaten on Tuesday. Rising concerns over the US debt ceiling weigh heavily on S&P500. A stretch in the US debt ceiling would attract a downgrade rating for the US long-term outlook.
Meanwhile, the USD Index has corrected sharply to near 101.70 after commentary from Heather Boushey, member of the Council of US Economic Advisers that interest rate hikes from the Fed were having a negative impact on the banking sector, as reported by Reuters. This could force Fed chair Jerome Powell to remain neutral on interest rate guidance as a 25 basis points (bp) rate hike is widely anticipated.
Rising concerns over the US debt ceiling have heavily weighed on yields as US Treasury would be out of funds in early June if the White House failed to raise the debt ceiling sooner. The 10-year US Treasury yields have dropped to near 3.43%.
Apart from the Fed policy, investors will also focus on the US Automatic Data Processing (ADP) Employment data. As per the consensus, the US economy added 150K fresh jobs in April, higher than the former additions of 145K.
On the oil front, oil prices have turned sideways around $71.50 after a nosedive move as Western central banks are preparing for a fresh rate hike cycle. Apart from the Fed, the European Central Bank (ECB) will raise interest rates on Thursday. Next week, the Bank of England (BoE) is expected to raise interest rates further to curb inflation.
It is worth noting that India is one of the leading importers of oil in the world and lower oil prices will support the Indian rupee.
Technical Levels: Supports and Resistances
USDINR currently trading at 81.8113 at the time of writing. Pair opened at 81.8166 and is trading with a change of -0.01 % .
| Overview | Overview.1 | |
|---|---|---|
| 0 | Today last price | 81.8113 |
| 1 | Today Daily Change | -0.0053 |
| 2 | Today Daily Change % | -0.0100 |
| 3 | Today daily open | 81.8166 |
The pair is trading below its 20 Daily moving average @ 81.921, below its 50 Daily moving average @ 82.1713 , below its 100 Daily moving average @ 82.2172 and above its 200 Daily moving average @ 81.5933
| Trends | Trends.1 | |
|---|---|---|
| 0 | Daily SMA20 | 81.9210 |
| 1 | Daily SMA50 | 82.1713 |
| 2 | Daily SMA100 | 82.2172 |
| 3 | Daily SMA200 | 81.5933 |
The previous day high was 81.9525 while the previous day low was 81.6934. The daily 38.2% Fib levels comes at 81.8535, expected to provide resistance. Similarly, the daily 61.8% fib level is at 81.7924, expected to provide resistance.
Note the levels of interest below:
- Pivot support is noted at 81.6892, 81.5617, 81.4301
- Pivot resistance is noted at 81.9483, 82.08, 82.2074
| Levels | Levels.1 |
|---|---|
| Previous Daily High | 81.9525 |
| Previous Daily Low | 81.6934 |
| Previous Weekly High | 82.1614 |
| Previous Weekly Low | 81.4850 |
| Previous Monthly High | 82.5092 |
| Previous Monthly Low | 81.4850 |
| Daily Fibonacci 38.2% | 81.8535 |
| Daily Fibonacci 61.8% | 81.7924 |
| Daily Pivot Point S1 | 81.6892 |
| Daily Pivot Point S2 | 81.5617 |
| Daily Pivot Point S3 | 81.4301 |
| Daily Pivot Point R1 | 81.9483 |
| Daily Pivot Point R2 | 82.0800 |
| Daily Pivot Point R3 | 82.2074 |
[/s2If]
Nehcap Expert Advisor
The NEHCAP MT4 EA is high quality professional trading system geared to generate returns without using GRID or martingales. Each trade has strict risk per trade parameter. The pairs under management include EURUSD, GBPUSD, AUDCAD, AUDNZD,GBPAUD, EURAUD, EURCAD, CHFJPY and many more.
The system is trading live: LIVE ACCOUNT TRACKING
You can run it free. Apply for a free trial and track our account. Buy the system or use profit share mechanism to generate returns on your MT4.
Join Our Telegram Group
")


