US Dollar Index remains pressured after reversing from three-week high. (Pivot Orderbook analysis)
…
This is a premium post.
[s2If !current_user_can(access_s2member_level4)]Please register for FREE REGISTER to read full post below containing analysis. In case of any error or you think you are not able to read the full post below, please email us at support#nehcap.com [lwa][/s2If] [s2If current_user_can(access_s2member_level1)]
- US Dollar Index remains pressured after reversing from three-week high.
- Fears of easing US job market strength, limited scope for Fed hawks amid recession woes challenge DXY bulls.
- Banking sector fears, hopes of no policy pivot in 2023 put a floor under greenback.
- US ADP Employment Change, PMIs for April may also entertain traders but FOMC will be the key.
The pair currently trades last at 101.86.
The previous day high was 102.19 while the previous day low was 101.59. The daily 38.2% Fib levels comes at 101.96, expected to provide resistance. Similarly, the daily 61.8% fib level is at 101.82, expected to provide support.
US Dollar Index (DXY) takes offers to extend the previous day’s U-turn from a three-week high while refreshing intraday low near 101.85 during the early hours of Wednesday’s Asian session. In doing so, the greenback’s gauge versus the six major currencies bears the burden of mixed US data, as well as a cautious mood ahead of today’s Federal Open Market Committee (FOMC) monetary policy meeting announcements.
On Tuesday, US Factory Orders for March improved to 0.9% versus 0.8% expected and -1.1% (revised) previous readings. However, the US JOLTS Job Openings for the said month eased to 9.59M from 9.974M prior and 9.775M market forecasts.
It’s worth noting that the easing of the US Gross Domestic Product (GDP) joined mixed ISM PMI details to prod the DXY bulls previously. However, upbeat inflation clues defend the Fed hawks, which in turn suggests the US central bank is all set for a 0.25% rate hike. As a result, traders are more interested in hearing about the Fed’s policy pivot, previously anticipated to take place in 2023, for clear US Dollar Index guidance.
Elsewhere, fresh selling of PacWest Bancorp and Western Alliance Bancorp shares triggered banking fears across the board and put a floor under the US Dollar price, especially amid hawkish Fed bets. Additionally weighing on the market sentiment and challenging the US Dollar could be the US policymakers’ struggle to avoid debt ceiling expiration, looming in June versus previous expectations of July expiry.
Amid these plays, Wall Street closed in the red and the US Treasury bond yields also dropped whereas S&P 500 Futures also print mild losses at the latest.
Looking ahead, the US ADP Employment Change for April and the ISM Services PMI for the said month can entertain DXY traders. However, major attention will be given to the Federal Reserve (Fed) announcements and the banking headlines for clear guidance.
Also read: FOMC Meeting Preview: Powell to keep every door open, surprises not out of the table after RBA
Despite the latest retreat, the US Dollar Index (DXY) price remains beyond the 101.80-75 support confluence comprising the 21-DMA and previous resistance line from late March, which in turn keeps the buyers hopeful.
Technical Levels: Supports and Resistances
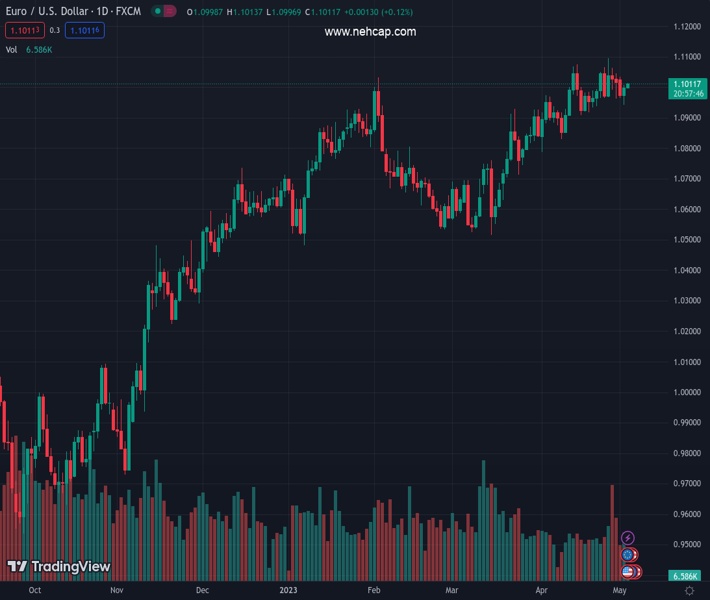
EURUSD currently trading at 101.86 at the time of writing. Pair opened at 102.1 and is trading with a change of -0.24% % .
| Overview | Overview.1 | |
|---|---|---|
| 0 | Today last price | 101.86 |
| 1 | Today Daily Change | -0.24 |
| 2 | Today Daily Change % | -0.24% |
| 3 | Today daily open | 102.1 |
The pair is trading above its 20 Daily moving average @ 101.78, below its 50 Daily moving average @ 103.06 , below its 100 Daily moving average @ 103.18 and below its 200 Daily moving average @ 106.15
| Trends | Trends.1 | |
|---|---|---|
| 0 | Daily SMA20 | 101.78 |
| 1 | Daily SMA50 | 103.06 |
| 2 | Daily SMA100 | 103.18 |
| 3 | Daily SMA200 | 106.15 |
The previous day high was 102.19 while the previous day low was 101.59. The daily 38.2% Fib levels comes at 101.96, expected to provide resistance. Similarly, the daily 61.8% fib level is at 101.82, expected to provide support.
Note the levels of interest below:
- Pivot support is noted at 101.74, 101.37, 101.14
- Pivot resistance is noted at 102.33, 102.56, 102.92
| Levels | Levels.1 |
|---|---|
| Previous Daily High | 102.19 |
| Previous Daily Low | 101.59 |
| Previous Weekly High | 102.18 |
| Previous Weekly Low | 101.01 |
| Previous Monthly High | 103.06 |
| Previous Monthly Low | 100.79 |
| Daily Fibonacci 38.2% | 101.96 |
| Daily Fibonacci 61.8% | 101.82 |
| Daily Pivot Point S1 | 101.74 |
| Daily Pivot Point S2 | 101.37 |
| Daily Pivot Point S3 | 101.14 |
| Daily Pivot Point R1 | 102.33 |
| Daily Pivot Point R2 | 102.56 |
| Daily Pivot Point R3 | 102.92 |
[/s2If]
Nehcap Expert Advisor
The NEHCAP MT4 EA is high quality professional trading system geared to generate returns without using GRID or martingales. Each trade has strict risk per trade parameter. The pairs under management include EURUSD, GBPUSD, AUDCAD, AUDNZD,GBPAUD, EURAUD, EURCAD, CHFJPY and many more.
The system is trading live: LIVE ACCOUNT TRACKING
You can run it free. Apply for a free trial and track our account. Buy the system or use profit share mechanism to generate returns on your MT4.
Join Our Telegram Group
")


