WTI loses ground for a fourth consecutive day as Wall Street reacts to Yellen’s debt obligation warning. (Pivot Orderbook analysis)
…
This is a premium post.
[s2If !current_user_can(access_s2member_level4)]Please register for FREE REGISTER to read full post below containing analysis. In case of any error or you think you are not able to read the full post below, please email us at support#nehcap.com [lwa][/s2If] [s2If current_user_can(access_s2member_level1)]
- WTI loses ground for a fourth consecutive day as Wall Street reacts to Yellen’s debt obligation warning.
- Oil prices are pressured by weak manufacturing activity in China.
- OPEC production cuts cushioned WTI price amidst economic uncertainty and falling demand.
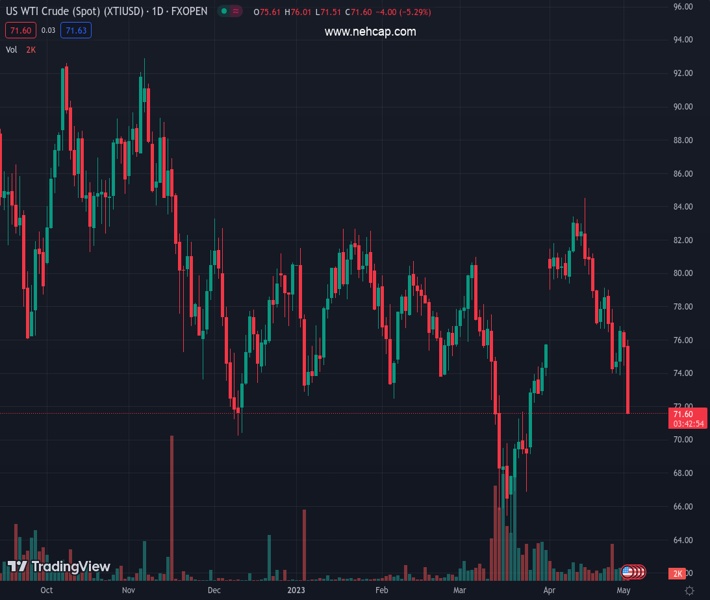
The pair currently trades last at 71.96.
The previous day high was 76.61 while the previous day low was 74.47. The daily 38.2% Fib levels comes at 75.29, expected to provide resistance. Similarly, the daily 61.8% fib level is at 75.79, expected to provide resistance.
Western Texas Intermediate (WTI), the US crude oil benchmark, plunges more than 4%, reaching a five-week low, on risk aversion spurred by fears of contagion amongst US regional banks, alongside worries about the debt ceiling in the US. The latest report on business activity in China showed that the economy dipped. Therefore, WTI is trading at $71.99 per barrel, down 4.94%.
WTI extended its losses for four straight days. Wall Street registers losses after US Treasury Secretary Haney Yellen commented that the US government could not pay its debt obligations by June 1.
Oil prices came under pressure as China’s manufacturing activity shrank in April, as the National Bureau of Statistics (NBS) revealed. Manufacturing PMI dropped from 51.9 to 49.2 in April, while the Non-Manufacturing PMI edged down to 56.4 vs. 58.2 in March. The Composite figure stood at 54.4 from 57.0.
Zhao Qinghe, a Senior NBS statistician, said, “A lack of market demand and the high-base effect from the quick manufacturing recovery in the first quarter” was among the factors that led to the contraction in April.”
Reuters cited sources commented, “The unpredictable action of central banks in their mission to tame elevated consumer and producer prices, the rhetoric and action of consuming and producing nations have all cast a rather long shadow of doubt on prospects going forward.”
Two major central banks are expected to hike rates in the week: the Federal Reserve (Fed) and the European Central Bank (ECB).
Aside from this, WTI was cushioned as the Organization of Petroleum Exporting Countries (OPEC) cut its output by 190K bpd in March. The cartel agreed to cut production in late 2022 as the economic outlook worsened. For April, OPEC agreed to cut output by 1.27 million bpd, part of a 2 million reduction by the OPEC+ last year.
Technical Levels: Supports and Resistances
XTIUSD currently trading at 71.96 at the time of writing. Pair opened at 75.68 and is trading with a change of -4.92 % .
| Overview | Overview.1 | |
|---|---|---|
| 0 | Today last price | 71.96 |
| 1 | Today Daily Change | -3.72 |
| 2 | Today Daily Change % | -4.92 |
| 3 | Today daily open | 75.68 |
The pair remains strongly bearish on the daily time frame. It trades below the 20 SMA @ 79.23, 50 SMA 76.1, 100 SMA @ 77.04 and 200 SMA @ 81.52.
| Trends | Trends.1 | |
|---|---|---|
| 0 | Daily SMA20 | 79.23 |
| 1 | Daily SMA50 | 76.10 |
| 2 | Daily SMA100 | 77.04 |
| 3 | Daily SMA200 | 81.52 |
The previous day high was 76.61 while the previous day low was 74.47. The daily 38.2% Fib levels comes at 75.29, expected to provide resistance. Similarly, the daily 61.8% fib level is at 75.79, expected to provide resistance.
Note the levels of interest below:
- Pivot support is noted at 74.56, 73.45, 72.42
- Pivot resistance is noted at 76.7, 77.72, 78.84
| Levels | Levels.1 |
|---|---|
| Previous Daily High | 76.61 |
| Previous Daily Low | 74.47 |
| Previous Weekly High | 79.14 |
| Previous Weekly Low | 73.88 |
| Previous Monthly High | 83.40 |
| Previous Monthly Low | 73.88 |
| Daily Fibonacci 38.2% | 75.29 |
| Daily Fibonacci 61.8% | 75.79 |
| Daily Pivot Point S1 | 74.56 |
| Daily Pivot Point S2 | 73.45 |
| Daily Pivot Point S3 | 72.42 |
| Daily Pivot Point R1 | 76.70 |
| Daily Pivot Point R2 | 77.72 |
| Daily Pivot Point R3 | 78.84 |
[/s2If]
Nehcap Expert Advisor
The NEHCAP MT4 EA is high quality professional trading system geared to generate returns without using GRID or martingales. Each trade has strict risk per trade parameter. The pairs under management include EURUSD, GBPUSD, AUDCAD, AUDNZD,GBPAUD, EURAUD, EURCAD, CHFJPY and many more.
The system is trading live: LIVE ACCOUNT TRACKING
You can run it free. Apply for a free trial and track our account. Buy the system or use profit share mechanism to generate returns on your MT4.
Join Our Telegram Group
")


