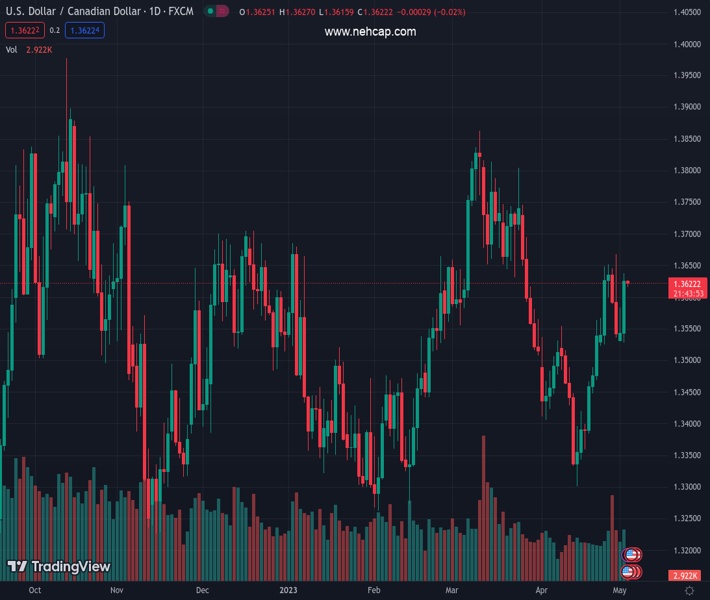
#USDCAD @ 1.36220 remains sidelined after rising the most in a week and snapping three-day downtrend. (Pivot Orderbook analysis)
…
This is a premium post.
[s2If !current_user_can(access_s2member_level4)]Please register for FREE REGISTER to read full post below containing analysis. In case of any error or you think you are not able to read the full post below, please email us at support#nehcap.com [lwa][/s2If] [s2If current_user_can(access_s2member_level1)]
- USD/CAD remains sidelined after rising the most in a week and snapping three-day downtrend.
- Oil price slumps to five-week low on risk aversion, API inventories.
- US ADP Employment Change, ISM Services PMI can entertain traders ahead of FOMC.
- Loonie sellers seek Fed’s policy pivot hints to retake control as 0.25% rate hike is almost given.
The pair currently trades last at 1.36220.
The previous day high was 1.3583 while the previous day low was 1.353. The daily 38.2% Fib levels comes at 1.355, expected to provide support. Similarly, the daily 61.8% fib level is at 1.3563, expected to provide support.
USD/CAD seesaws around 1.3625-30 during the initial hours of Wednesday’s Asian trading session, following the heaviest daily jump in a week, as traders await the key US data/events. That said, the Loonie pair cheered a slump in the WTI crude oil prices, Canada’s main exports, together with the risk-off mood, the previous day.
WTI crude oil remains depressed at the lowest levels in five weeks, licking its wounds near $71.50 by the press time, amid a generally lackluster early trading session of the day. The energy benchmark dropped the most in eight months the previous day as market’s fears from banking fallouts and hawkish central bank actions joined the slower-than-previous draw of the weekly Oil inventories per the industry report. That said, the American Petroleum Institute (API) said that the Weekly Crude Oil Stock declined by -3.939M during the week ended on April 28 versus -6.083M prior.
Talking about the risks, fresh selling of PacWest Bancorp and Western Alliance Bancorp shares triggered banking fears across the board and put a floor under the US Dollar price, especially amid hawkish Fed bets. However, mixed US data and softer US Treasury bond yields prod the greenback buyers ahead of the key US factors up for publishing.
On the other hand, the US Dollar Index (DXY) initially rushed to refresh a three-week high before retreating to 102.00 amid mixed US data. That said, US Factory Orders for March improved to 0.9% versus 0.8% expected and -1.1% (revised) previous readings. Elsewhere, the US JOLTS Job Openings for the said month eased to 9.59M from 9.974M prior and 9.775M market forecasts.
Against this backdrop, Wall Street closed in the red and the US Treasury bond yields also dropped. On the same line, S&P 500 Futures also print mild losses at the latest.
Moving on, the US ADP Employment Change for April and the ISM Services PMI for the said month. However, major attention will be given to the Federal Reserve (Fed) announcements and the banking headlines for clear guidance.
Also read: FOMC Meeting Preview: Powell to keep every door open, surprises not out of the table after RBA
USD/CAD remains on the bull’s radar as it bounced off the 100-DMA support of around 1.3525 by the press time, suggesting another attempt to cross the key resistance line from early March, near 1.3635 at the latest.
Technical Levels: Supports and Resistances
USDCAD currently trading at 1.3624 at the time of writing. Pair opened at 1.3543 and is trading with a change of 0.6 % .
| Overview | Overview.1 | |
|---|---|---|
| 0 | Today last price | 1.3624 |
| 1 | Today Daily Change | 0.0081 |
| 2 | Today Daily Change % | 0.6000 |
| 3 | Today daily open | 1.3543 |
The pair remains strongly bullish on the daily timeframe. It trades above its 20 SMA @ 1.3489, 50 SMA 1.3587, 100 SMA @ 1.3527 and 200 SMA @ 1.3432.
| Trends | Trends.1 | |
|---|---|---|
| 0 | Daily SMA20 | 1.3489 |
| 1 | Daily SMA50 | 1.3587 |
| 2 | Daily SMA100 | 1.3527 |
| 3 | Daily SMA200 | 1.3432 |
The previous day high was 1.3583 while the previous day low was 1.353. The daily 38.2% Fib levels comes at 1.355, expected to provide support. Similarly, the daily 61.8% fib level is at 1.3563, expected to provide support.
Note the levels of interest below:
- Pivot support is noted at 1.3521, 1.3499, 1.3468
- Pivot resistance is noted at 1.3574, 1.3605, 1.3627
| Levels | Levels.1 |
|---|---|
| Previous Daily High | 1.3583 |
| Previous Daily Low | 1.3530 |
| Previous Weekly High | 1.3668 |
| Previous Weekly Low | 1.3523 |
| Previous Monthly High | 1.3668 |
| Previous Monthly Low | 1.3301 |
| Daily Fibonacci 38.2% | 1.3550 |
| Daily Fibonacci 61.8% | 1.3563 |
| Daily Pivot Point S1 | 1.3521 |
| Daily Pivot Point S2 | 1.3499 |
| Daily Pivot Point S3 | 1.3468 |
| Daily Pivot Point R1 | 1.3574 |
| Daily Pivot Point R2 | 1.3605 |
| Daily Pivot Point R3 | 1.3627 |
[/s2If]
Nehcap Expert Advisor
The NEHCAP MT4 EA is high quality professional trading system geared to generate returns without using GRID or martingales. Each trade has strict risk per trade parameter. The pairs under management include EURUSD, GBPUSD, AUDCAD, AUDNZD,GBPAUD, EURAUD, EURCAD, CHFJPY and many more.
The system is trading live: LIVE ACCOUNT TRACKING
You can run it free. Apply for a free trial and track our account. Buy the system or use profit share mechanism to generate returns on your MT4.
Join Our Telegram Group
")


