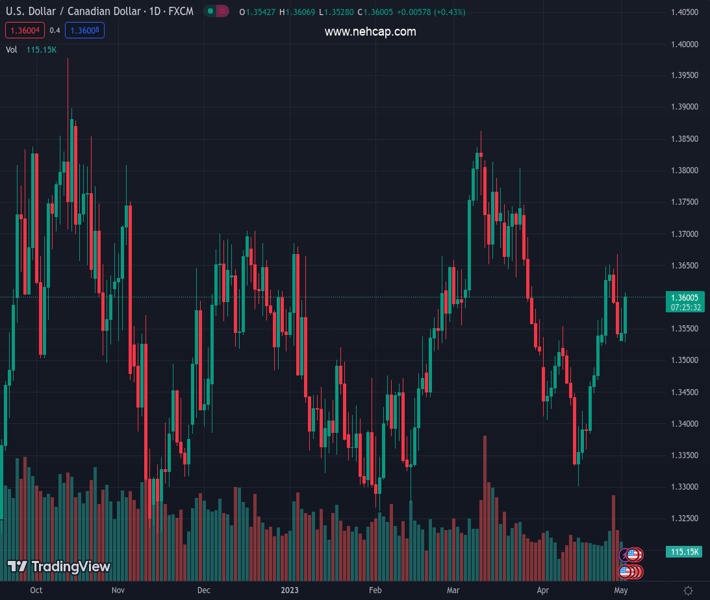
#USDCAD @ 1.36046 rebounds swiftly from the 100 DMA, a one-week low touched this Tuesday. (Pivot Orderbook analysis)
…
This is a premium post.
[s2If !current_user_can(access_s2member_level4)]Please register for FREE REGISTER to read full post below containing analysis. In case of any error or you think you are not able to read the full post below, please email us at support#nehcap.com [lwa][/s2If] [s2If current_user_can(access_s2member_level1)]
- USD/CAD rebounds swiftly from the 100 DMA, a one-week low touched this Tuesday.
- Sliding Oil prices undermines the Loonie and lends support amid a modest USD uptick.
- Bets for another 25 bps Fed rate hike and a softer risk tone benefit the safe-haven buck.
The pair currently trades last at 1.36046.
The previous day high was 1.3583 while the previous day low was 1.353. The daily 38.2% Fib levels comes at 1.355, expected to provide support. Similarly, the daily 61.8% fib level is at 1.3563, expected to provide support.
The USD/CAD pair attracts fresh buying near the 100-day Simple Moving Average (SMA) for the second successive day and stages a solid recovery from a one-week low, around the 1.3530-1.3525 region touched this Tuesday. The intraday positive move lifts spot prices to the 1.3600 neighbourhood during the early North American session and is sponsored by a combination of factors.
Crude Oil prices remain under some selling pressure for the second straight day and languish near a one-month low touched last week amid worries about economic headwinds stemming from rising borrowing costs, which might dent fuel demand. This, in turn, is seen undermining the commodity-linked Loonie and acts as a tailwind for the USD/CAD pair. The US Dollar (USD), on the other hand, touches a fresh two-week high amid the prospects for additional intraday rate hikes by the Federal Reserve (Fed) and provides an additional boost to the major.
In fact, the markets now seem to have fully priced in another 25 bps rate hike at the end of the two-day meeting on Wednesday. Moreover, the US ISM report released on Monday showed that there was a build-up of inflation pressures last month and kept alive the possibility of a further hike in June. This, along with looming recession fears and a generally weaker tone around the equity markets, further benefit the Greenback’s relative safe-haven status and remains supportive of the USD/CAD pair’s strong intraday rally of around 75 pips.
Next on tap is the release of the JOLTS Job Openings and Factory Orders data from the US. Apart from this, the broader risk sentiment will drive the USD demand and provide some impetus to the USD/CAD pair. Traders will further take cues from Oil price dynamics to grab short-term opportunities. The focus, however, will remain glued to the highly-anticipated FOMC decision, which, along with the US monthly employment details (NFP) on Friday, will help investors to determine the next leg of a directional move for the major.
Technical Levels: Supports and Resistances
USDCAD currently trading at 1.3601 at the time of writing. Pair opened at 1.3543 and is trading with a change of 0.43 % .
| Overview | Overview.1 | |
|---|---|---|
| 0 | Today last price | 1.3601 |
| 1 | Today Daily Change | 0.0058 |
| 2 | Today Daily Change % | 0.4300 |
| 3 | Today daily open | 1.3543 |
The pair remains strongly bullish on the daily timeframe. It trades above its 20 SMA @ 1.3489, 50 SMA 1.3587, 100 SMA @ 1.3527 and 200 SMA @ 1.3432.
| Trends | Trends.1 | |
|---|---|---|
| 0 | Daily SMA20 | 1.3489 |
| 1 | Daily SMA50 | 1.3587 |
| 2 | Daily SMA100 | 1.3527 |
| 3 | Daily SMA200 | 1.3432 |
The previous day high was 1.3583 while the previous day low was 1.353. The daily 38.2% Fib levels comes at 1.355, expected to provide support. Similarly, the daily 61.8% fib level is at 1.3563, expected to provide support.
Note the levels of interest below:
- Pivot support is noted at 1.3521, 1.3499, 1.3468
- Pivot resistance is noted at 1.3574, 1.3605, 1.3627
| Levels | Levels.1 |
|---|---|
| Previous Daily High | 1.3583 |
| Previous Daily Low | 1.3530 |
| Previous Weekly High | 1.3668 |
| Previous Weekly Low | 1.3523 |
| Previous Monthly High | 1.3668 |
| Previous Monthly Low | 1.3301 |
| Daily Fibonacci 38.2% | 1.3550 |
| Daily Fibonacci 61.8% | 1.3563 |
| Daily Pivot Point S1 | 1.3521 |
| Daily Pivot Point S2 | 1.3499 |
| Daily Pivot Point S3 | 1.3468 |
| Daily Pivot Point R1 | 1.3574 |
| Daily Pivot Point R2 | 1.3605 |
| Daily Pivot Point R3 | 1.3627 |
[/s2If]
Nehcap Expert Advisor
The NEHCAP MT4 EA is high quality professional trading system geared to generate returns without using GRID or martingales. Each trade has strict risk per trade parameter. The pairs under management include EURUSD, GBPUSD, AUDCAD, AUDNZD,GBPAUD, EURAUD, EURCAD, CHFJPY and many more.
The system is trading live: LIVE ACCOUNT TRACKING
You can run it free. Apply for a free trial and track our account. Buy the system or use profit share mechanism to generate returns on your MT4.
Join Our Telegram Group
")


