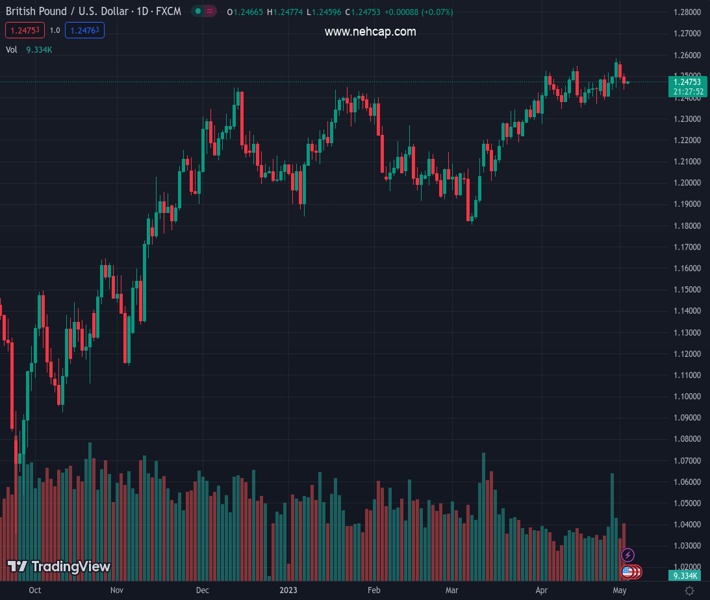
#GBPUSD @ 1.24758 is displaying a sideways auction as the focus has shifted to Fed policy. (Pivot Orderbook analysis)
…
This is a premium post.
[s2If !current_user_can(access_s2member_level4)]Please register for FREE REGISTER to read full post below containing analysis. In case of any error or you think you are not able to read the full post below, please email us at support#nehcap.com [lwa][/s2If] [s2If current_user_can(access_s2member_level1)]
- GBP/USD is displaying a sideways auction as the focus has shifted to Fed policy.
- The BoE policymakers are preparing for a 12th consecutive interest rate hike to tame double-digit UK inflation.
- The current variation of the Rising Channel lacks strength and is signaling a loss in the upside momentum.
The pair currently trades last at 1.24758.
The previous day high was 1.2571 while the previous day low was 1.2481. The daily 38.2% Fib levels comes at 1.2515, expected to provide resistance. Similarly, the daily 61.8% fib level is at 1.2536, expected to provide resistance.
The GBP/USD pair is demonstrating a sideways performance after around 1.2470 after a recovery move from 1.2440 in the early Toyo session. The Cable has defended its crucial support of 1.2440 for now, however, uncertainty will remain ahead of the interest rate policy by the Federal Reserve (Fed).
S&P500 futures have added more losses in early Asia after an extremely bearish Tuesday as concerns over a delay in the United States debt ceiling and deepening fears of a recession ahead of the Fed policy have dented the confidence of investors.
The US Dollar Index (DXY) is consolidating below 102.00 after a healthy correction from 102.30 as an extension in the debt ceiling would impact the long-term outlook of the US economy.
On the Pound Sterling front, Bank of England (BoE) policymakers are preparing for a 12th consecutive interest rate hike to tame double-digit United Kingdom inflation.
GBP/USD is auctioning in a Rising Channel chart pattern on a two-hour scale. The current variation of the Rising Channel lacks strength and is signaling a loss in the upside momentum. The upper portion of the aforementioned chart pattern is plotted from April 04 high at 1.2525 while the lower portion is placed from April 03 low at 1.2275.
The Cable is below the 20-period Exponential Moving Average (EMA) at 1.2488, indicating that US Dollar bulls have an upper hand.
Meanwhile, the Relative Strength Index (RSI) (14) is oscillating in the 40.00-60.00 range, signaling an action only after the Fed’s monetary policy.
A decisive move above April 14 high at 1.2546 will drive the asset towards a fresh 10-month high at 1.2597, which is 08 June 2022 high. A breach of the latter will expose the asset to May 27 high at 1.2667.
On the flip side, a slippage below April 10 low at 1.2345 will expose the asset to March 30 low at 1.2294 followed by March 27 low at 1.2219.
Technical Levels: Supports and Resistances
GBPUSD currently trading at 1.2472 at the time of writing. Pair opened at 1.2496 and is trading with a change of -0.19 % .
| Overview | Overview.1 | |
|---|---|---|
| 0 | Today last price | 1.2472 |
| 1 | Today Daily Change | -0.0024 |
| 2 | Today Daily Change % | -0.1900 |
| 3 | Today daily open | 1.2496 |
The pair remains strongly bullish on the daily timeframe. It trades above its 20 SMA @ 1.2455, 50 SMA 1.226, 100 SMA @ 1.2214 and 200 SMA @ 1.1942.
| Trends | Trends.1 | |
|---|---|---|
| 0 | Daily SMA20 | 1.2455 |
| 1 | Daily SMA50 | 1.2260 |
| 2 | Daily SMA100 | 1.2214 |
| 3 | Daily SMA200 | 1.1942 |
The previous day high was 1.2571 while the previous day low was 1.2481. The daily 38.2% Fib levels comes at 1.2515, expected to provide resistance. Similarly, the daily 61.8% fib level is at 1.2536, expected to provide resistance.
Note the levels of interest below:
- Pivot support is noted at 1.2461, 1.2426, 1.2371
- Pivot resistance is noted at 1.2551, 1.2606, 1.2642
| Levels | Levels.1 |
|---|---|
| Previous Daily High | 1.2571 |
| Previous Daily Low | 1.2481 |
| Previous Weekly High | 1.2584 |
| Previous Weekly Low | 1.2387 |
| Previous Monthly High | 1.2584 |
| Previous Monthly Low | 1.2275 |
| Daily Fibonacci 38.2% | 1.2515 |
| Daily Fibonacci 61.8% | 1.2536 |
| Daily Pivot Point S1 | 1.2461 |
| Daily Pivot Point S2 | 1.2426 |
| Daily Pivot Point S3 | 1.2371 |
| Daily Pivot Point R1 | 1.2551 |
| Daily Pivot Point R2 | 1.2606 |
| Daily Pivot Point R3 | 1.2642 |
[/s2If]
Nehcap Expert Advisor
The NEHCAP MT4 EA is high quality professional trading system geared to generate returns without using GRID or martingales. Each trade has strict risk per trade parameter. The pairs under management include EURUSD, GBPUSD, AUDCAD, AUDNZD,GBPAUD, EURAUD, EURCAD, CHFJPY and many more.
The system is trading live: LIVE ACCOUNT TRACKING
You can run it free. Apply for a free trial and track our account. Buy the system or use profit share mechanism to generate returns on your MT4.
Join Our Telegram Group
")


