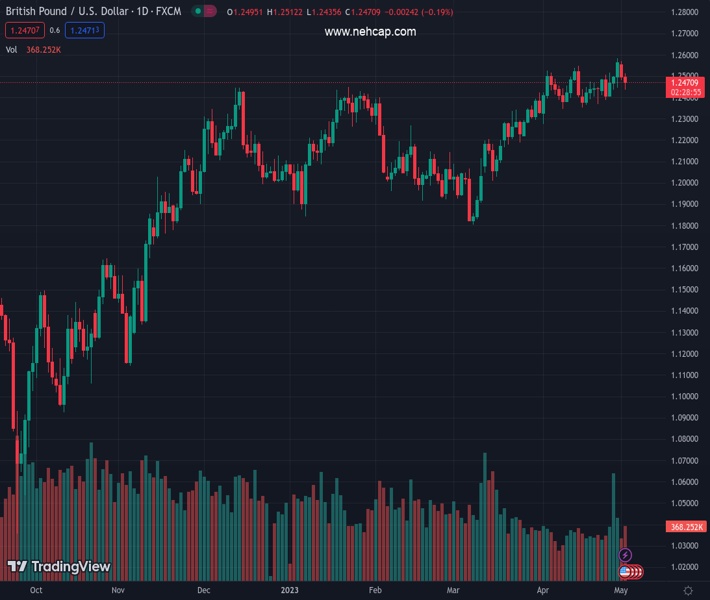
#GBPUSD @ 1.24701 falls on risk-off impulse as the US bank crisis worsens. (Pivot Orderbook analysis)
…
This is a premium post.
[s2If !current_user_can(access_s2member_level4)]Please register for FREE REGISTER to read full post below containing analysis. In case of any error or you think you are not able to read the full post below, please email us at support#nehcap.com [lwa][/s2If] [s2If current_user_can(access_s2member_level1)]
- GBP/USD falls on risk-off impulse as the US bank crisis worsens.
- US job openings for March were below estimates, while Factory Orders rose by 0.09% MoM, beating expectations
- GBP/USD Price Analysis: A break below the 20-day EMA leads to the downside, else re-test of the YTD high is likely.
The pair currently trades last at 1.24701.
The previous day high was 1.2571 while the previous day low was 1.2481. The daily 38.2% Fib levels comes at 1.2515, expected to provide resistance. Similarly, the daily 61.8% fib level is at 1.2536, expected to provide resistance.
The Pound Sterling (GBP) lost some ground against the US Dollar (USD) spurred by risk aversion amidst growing fears that the banking crisis in the United States (US), while the US debt ceiling theme, take the spotlight ahead of the Federal Reserve (Fed) decision. At the time of typing, the GBP/USD is trading at around the 1.2470-80 areas after dipping towards 1.2435.
Sentiment deteriorated, even though JP Morgan acquired the First Republic Bank on Monday. The US bank crisis continues, as the KBW Regional Banking Index, dropped more than 6%, at its lowest level since November 2020.
The GBP/USD dropped on a risk-off impulse, triggered by the US Secretary of Treasure Janet Yellen commenting that her office would not meet all the US government obligations by the beginning of June, wrote in a letter to the US Congress.
Nevertheless, the GBP/USD’s fall was cushioned, as data from the United States (US) revealed by the Bureau of Labor Statistics (BLS) flashed that job openings for March dropped to 9.590 million, below estimates of 9.775 million, according to the JOLTs report. At the same time, the US Department of Commerce revealed that Factory Orders increased by 0.09% MoM, exceeding estimates and distancing from February’s drop of 1.1%.
On the UK front, British factory output and new orders contracted at the beginning of Q2, though the report showed that input costs rose to their weakest level since May 2020.
In the meantime, the GBP/USD uptrend might stall as investors brace for the Fed’s May meeting that ends on Wednesday. Money market futures odds for a 25 bps rate increase are 87.3%. Nevertheless, traders estimate three rate cuts by the end of 2023, contrary to expectations for further tightening by the Bank of England (BoE)
After dipping to a weekly low of 1.2435, the GBP/USD found support at the 20-day Exponential Moving Average (EMA) at 1.2437. Although the pair printed back-to-back bearish candlesticks, a daily close below the latter will exacerbate a fall to the last week’s low, April’s 21 cycle low at 1.2367. Conversely, if GBP/USD buyers reclaim the 1.2500 figure, a re-test of the YTD high at 1.2583 is likely to happen, ahead of 1.2600.
Technical Levels: Supports and Resistances
GBPUSD currently trading at 1.2472 at the time of writing. Pair opened at 1.2496 and is trading with a change of -0.19 % .
| Overview | Overview.1 | |
|---|---|---|
| 0 | Today last price | 1.2472 |
| 1 | Today Daily Change | -0.0024 |
| 2 | Today Daily Change % | -0.1900 |
| 3 | Today daily open | 1.2496 |
The pair remains strongly bullish on the daily timeframe. It trades above its 20 SMA @ 1.2455, 50 SMA 1.226, 100 SMA @ 1.2214 and 200 SMA @ 1.1942.
| Trends | Trends.1 | |
|---|---|---|
| 0 | Daily SMA20 | 1.2455 |
| 1 | Daily SMA50 | 1.2260 |
| 2 | Daily SMA100 | 1.2214 |
| 3 | Daily SMA200 | 1.1942 |
The previous day high was 1.2571 while the previous day low was 1.2481. The daily 38.2% Fib levels comes at 1.2515, expected to provide resistance. Similarly, the daily 61.8% fib level is at 1.2536, expected to provide resistance.
Note the levels of interest below:
- Pivot support is noted at 1.2461, 1.2426, 1.2371
- Pivot resistance is noted at 1.2551, 1.2606, 1.2642
| Levels | Levels.1 |
|---|---|
| Previous Daily High | 1.2571 |
| Previous Daily Low | 1.2481 |
| Previous Weekly High | 1.2584 |
| Previous Weekly Low | 1.2387 |
| Previous Monthly High | 1.2584 |
| Previous Monthly Low | 1.2275 |
| Daily Fibonacci 38.2% | 1.2515 |
| Daily Fibonacci 61.8% | 1.2536 |
| Daily Pivot Point S1 | 1.2461 |
| Daily Pivot Point S2 | 1.2426 |
| Daily Pivot Point S3 | 1.2371 |
| Daily Pivot Point R1 | 1.2551 |
| Daily Pivot Point R2 | 1.2606 |
| Daily Pivot Point R3 | 1.2642 |
[/s2If]
Nehcap Expert Advisor
The NEHCAP MT4 EA is high quality professional trading system geared to generate returns without using GRID or martingales. Each trade has strict risk per trade parameter. The pairs under management include EURUSD, GBPUSD, AUDCAD, AUDNZD,GBPAUD, EURAUD, EURCAD, CHFJPY and many more.
The system is trading live: LIVE ACCOUNT TRACKING
You can run it free. Apply for a free trial and track our account. Buy the system or use profit share mechanism to generate returns on your MT4.
Join Our Telegram Group
")


