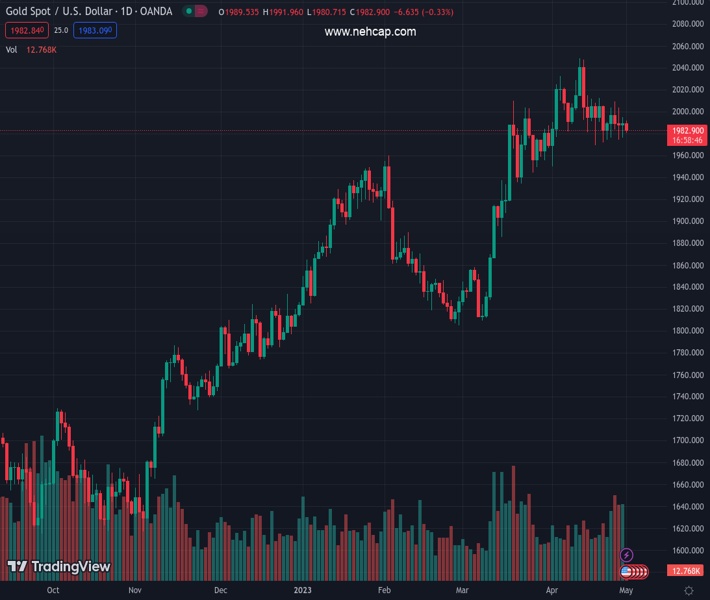
#XAUUSD @ 1,983.36 Gold price is expected to display sheer weakness below $1,970.00 amid a recovery in the USD Index. (Pivot Orderbook analysis)
…
This is a premium post.
[s2If !current_user_can(access_s2member_level4)]Please register for FREE REGISTER to read full post below containing analysis. In case of any error or you think you are not able to read the full post below, please email us at support#nehcap.com [lwa][/s2If] [s2If current_user_can(access_s2member_level1)]
- Gold price is expected to display sheer weakness below $1,970.00 amid a recovery in the USD Index.
- Easing US banking jitters has trimmed the appeal for the Gold price as a safe-haven.
- The USD Index will remain in action amid the release of the US ISM Manufacturing PMI data.
The pair currently trades last at 1983.36.
The previous day high was 1995.07 while the previous day low was 1976.28. The daily 38.2% Fib levels comes at 1987.89, expected to provide resistance. Similarly, the daily 61.8% fib level is at 1983.46, expected to provide resistance.
Gold price (XAU/USD) is declining towards its crucial support of $1,970.00 in the Asian session. A solid recovery in the US Dollar Index (DXY) amid upbeat expectations that the Federal Reserve (Fed) will raise interest rates one more time by 25 basis points (bps) on Wednesday is impacting the Gold price. The precious metal might show a significant fall after a confident break below $1,970.00 as it has been acting as a major support from the past week.
S&P500 futures have recovered their entire losses generated in early Asia and has shifted into positive territory, portraying an upbeat market mood. Also, the demand for US government bonds looks solid. The 10-year US Treasury yields have dropped to near 3.43%.
The USD Index is expected to show a power-pack action on Monday amid the release of the United States ISM Manufacturing PMI (April) data. As per the consensus, the economic data is seen higher at 46.6 from the former release of 46.3. A figure below 50.0 is considered a contraction in manufacturing activities and consistency with consensus will make it the sixth consecutive contracting month.
The headlines that JP Morgan and PNC are submitting final bids for First Republic Bank in Federal Deposit Insurance Corporation (FDIC) auction has eased United States banking jitters, which has trimmed appeal for the Gold price.
Apart from that, New Orders data that indicates forward demand is seen expanding to 45.5 vs. the prior release of 44.3.
Meanwhile, consumer spending in the United States economy seems resilient despite higher interest rates from the Fed. A surprise jump in Employment Cost Index (Q1) to 1.2% indicates that labor market conditions are upbeat and the Fed has no other option than to continue paddling interest rates.
Gold price is consolidating in a narrow range of $1,971-2,021 from the past week as investors are awaiting the monetary policy by the Fed for a decisive move. Upward-sloping trendline March 22 low at $1,934.34 is acting as a cushion for the Gold bulls.
The 20-period Exponential Moving Average (EMA) at $1,990.28 is showing stickiness to the Gold price, indicating a lackluster performance.
Meanwhile, the Relative Strength Index (RSI) (14) is on the verge of slipping into the bearish range of 20.00-40.00, which will activate the bearish momentum.
Technical Levels: Supports and Resistances
XAUUSD currently trading at 1981.85 at the time of writing. Pair opened at 1989.92 and is trading with a change of -0.41 % .
| Overview | Overview.1 | |
|---|---|---|
| 0 | Today last price | 1981.85 |
| 1 | Today Daily Change | -8.07 |
| 2 | Today Daily Change % | -0.41 |
| 3 | Today daily open | 1989.92 |
The pair is trading below its 20 Daily moving average @ 1999.67, above its 50 Daily moving average @ 1933.99 , above its 100 Daily moving average @ 1897.52 and above its 200 Daily moving average @ 1807.42
| Trends | Trends.1 | |
|---|---|---|
| 0 | Daily SMA20 | 1999.67 |
| 1 | Daily SMA50 | 1933.99 |
| 2 | Daily SMA100 | 1897.52 |
| 3 | Daily SMA200 | 1807.42 |
The previous day high was 1995.07 while the previous day low was 1976.28. The daily 38.2% Fib levels comes at 1987.89, expected to provide resistance. Similarly, the daily 61.8% fib level is at 1983.46, expected to provide resistance.
Note the levels of interest below:
- Pivot support is noted at 1979.11, 1968.3, 1960.32
- Pivot resistance is noted at 1997.9, 2005.88, 2016.69
| Levels | Levels.1 |
|---|---|
| Previous Daily High | 1995.07 |
| Previous Daily Low | 1976.28 |
| Previous Weekly High | 2009.41 |
| Previous Weekly Low | 1974.13 |
| Previous Monthly High | 2048.75 |
| Previous Monthly Low | 1949.83 |
| Daily Fibonacci 38.2% | 1987.89 |
| Daily Fibonacci 61.8% | 1983.46 |
| Daily Pivot Point S1 | 1979.11 |
| Daily Pivot Point S2 | 1968.30 |
| Daily Pivot Point S3 | 1960.32 |
| Daily Pivot Point R1 | 1997.90 |
| Daily Pivot Point R2 | 2005.88 |
| Daily Pivot Point R3 | 2016.69 |
[/s2If]
Nehcap Expert Advisor
The NEHCAP MT4 EA is high quality professional trading system geared to generate returns without using GRID or martingales. Each trade has strict risk per trade parameter. The pairs under management include EURUSD, GBPUSD, AUDCAD, AUDNZD,GBPAUD, EURAUD, EURCAD, CHFJPY and many more.
The system is trading live: LIVE ACCOUNT TRACKING
You can run it free. Apply for a free trial and track our account. Buy the system or use profit share mechanism to generate returns on your MT4.
Join Our Telegram Group
")


