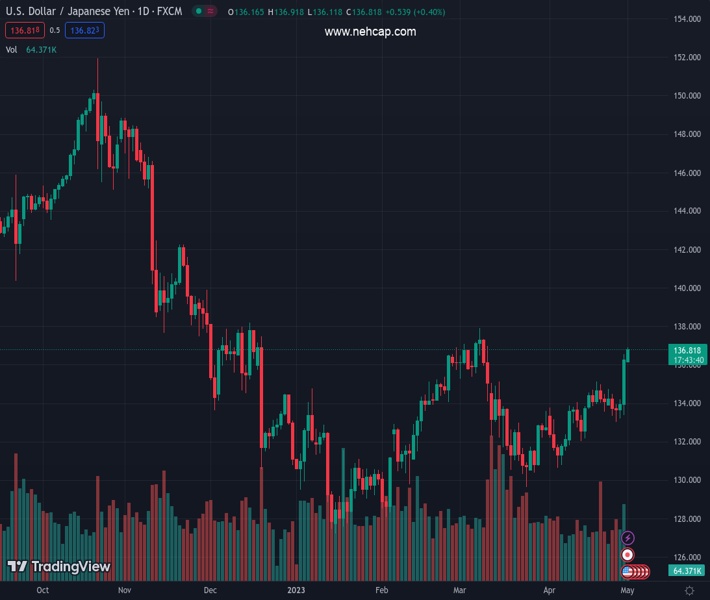
#USDJPY @ 136.828 takes the bids to refresh multi-day high, cheers upside break of a descending trend line from November., @nehcap view: Pullback expected (Pivot Orderbook analysis)
…
This is a premium post.
[s2If !current_user_can(access_s2member_level4)]Please register for FREE REGISTER to read full post below containing analysis. In case of any error or you think you are not able to read the full post below, please email us at support#nehcap.com [lwa][/s2If] [s2If current_user_can(access_s2member_level1)]
- USD/JPY takes the bids to refresh multi-day high, cheers upside break of a descending trend line from November.
- Yen pair buyers may struggle as 200-DMA, five-month-old horizontal resistance zone join overbought RSI (14).
- Bullish MACD signals, previous resistance line challenge USD/JPY sellers.
The pair currently trades last at 136.828.
The previous day high was 136.56 while the previous day low was 133.35. The daily 38.2% Fib levels comes at 135.34, expected to provide support. Similarly, the daily 61.8% fib level is at 134.58, expected to provide support.
USD/JPY buyers prod the 200-DMA hurdle as they push the limits of a two-month high near 137.00 during early Monday. In doing so, the Yen pair rises for the third consecutive day while cheering the previous day’s upside break of a downward-sloping resistance line from the last November, now the immediate support, as well as the bullish MACD signals.
However, the 200-DMA level surrounding the 137.00 round figure joins the overbought RSI (14) line to challenge the USD/JPY bulls of late.
Even if the Yen pair manages to overcome the 137.00 hurdle, a horizontal region comprising multiple levels marked since early December 2022, between 137.90 and 138.20, will be crucial for the pair buyers to watch.
Should the quote manages to remain firmer past 138.20, the odds of witnessing the USD/JPY rally targeting a 61.8% Fibonacci retracement level of the October 2022 to January 2023 downturn, near 142.55, will be in the spotlight.
Alternatively, USD/JPY pullback remains elusive unless the quote stays beyond the resistance-turned-support line, around 135.85 by the press time.
Even if the Yen pair drops below 135.85, the mid-April swing high around 135.15 and the five-week-old ascending support line near 133.70 could challenge the USD/JPY bears.
Overall, USD/JPY is likely to remain firmer but the quote’s additional rise depends upon a 138.20 breakout.
Trend: Pullback expected
Technical Levels: Supports and Resistances
USDJPY currently trading at 136.87 at the time of writing. Pair opened at 136.31 and is trading with a change of 0.41% % .
| Overview | Overview.1 | |
|---|---|---|
| 0 | Today last price | 136.87 |
| 1 | Today Daily Change | 0.56 |
| 2 | Today Daily Change % | 0.41% |
| 3 | Today daily open | 136.31 |
The pair is trading above its 20 Daily moving average @ 133.49, above its 50 Daily moving average @ 133.83 , above its 100 Daily moving average @ 132.89 and below its 200 Daily moving average @ 136.99
| Trends | Trends.1 | |
|---|---|---|
| 0 | Daily SMA20 | 133.49 |
| 1 | Daily SMA50 | 133.83 |
| 2 | Daily SMA100 | 132.89 |
| 3 | Daily SMA200 | 136.99 |
The previous day high was 136.56 while the previous day low was 133.35. The daily 38.2% Fib levels comes at 135.34, expected to provide support. Similarly, the daily 61.8% fib level is at 134.58, expected to provide support.
Note the levels of interest below:
- Pivot support is noted at 134.25, 132.19, 131.04
- Pivot resistance is noted at 137.47, 138.62, 140.68
| Levels | Levels.1 |
|---|---|
| Previous Daily High | 136.56 |
| Previous Daily Low | 133.35 |
| Previous Weekly High | 136.56 |
| Previous Weekly Low | 133.01 |
| Previous Monthly High | 136.56 |
| Previous Monthly Low | 130.63 |
| Daily Fibonacci 38.2% | 135.34 |
| Daily Fibonacci 61.8% | 134.58 |
| Daily Pivot Point S1 | 134.25 |
| Daily Pivot Point S2 | 132.19 |
| Daily Pivot Point S3 | 131.04 |
| Daily Pivot Point R1 | 137.47 |
| Daily Pivot Point R2 | 138.62 |
| Daily Pivot Point R3 | 140.68 |
[/s2If]
Nehcap Expert Advisor
The NEHCAP MT4 EA is high quality professional trading system geared to generate returns without using GRID or martingales. Each trade has strict risk per trade parameter. The pairs under management include EURUSD, GBPUSD, AUDCAD, AUDNZD,GBPAUD, EURAUD, EURCAD, CHFJPY and many more.
The system is trading live: LIVE ACCOUNT TRACKING
You can run it free. Apply for a free trial and track our account. Buy the system or use profit share mechanism to generate returns on your MT4.
Join Our Telegram Group
")


