#USDCAD @ 1.35528 struggles to defend corrective bounce from one-week low., @nehcap view: Limited downside expected (Pivot Orderbook analysis)
…
This is a premium post.
[s2If !current_user_can(access_s2member_level4)]Please register for FREE REGISTER to read full post below containing analysis. In case of any error or you think you are not able to read the full post below, please email us at support#nehcap.com [lwa][/s2If] [s2If current_user_can(access_s2member_level1)]
- USD/CAD struggles to defend corrective bounce from one-week low.
- U-turn from seven-week-old descending resistance line, downside break of fortnight-old previous support favor sellers.
- 100-EMA, 200-EMA together challenge Loonie pair bears amid steady RSI.
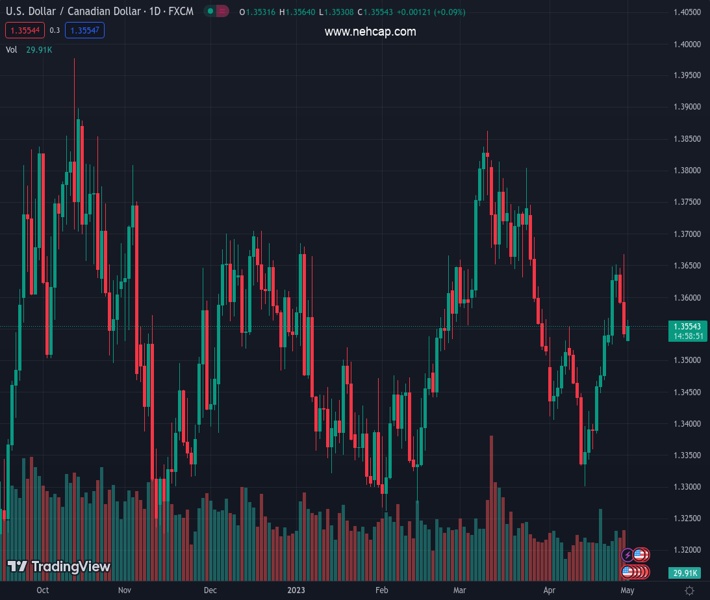
The pair currently trades last at 1.35528.
The previous day high was 1.3668 while the previous day low was 1.3536. The daily 38.2% Fib levels comes at 1.3586, expected to provide resistance. Similarly, the daily 61.8% fib level is at 1.3618, expected to provide resistance.
USD/CAD buyers struggle to keep the first daily gains in three as the quote retreats to 1.3550 heading into Monday’s European session. In doing so, the Loonie pair fades bounce off the convergence of the 100-bar and 200-bar Exponential Moving Averages (EMAs).
Given the quote’s clear pullback from a downward-sloping resistance line from early March, as well as a downside break of the previous support line stretched from April 14, the USD/CAD sellers remain hopeful. Adding strength to the downside bias are the bearish MACD signals.
However, the aforementioned key EMA confluence surrounding 1.3530 joins the downbeat RSI (14) to challenge the Loonie pair’s further declines.
In a case where the USD/CAD bears keep the reins past 1.3530, the 1.3500 round figure may act as an intermediate halt before directing the quote towards the early April swing low surrounding 1.3400. Following that, the previous monthly low of around 1.3300 will be in the spotlight.
Meanwhile, USD/CAD recovery needs validation from a two-week-long support-turned-resistance, around 1.3630 by the press time.
Even so, a convergence of the downward-sloping resistance line from early March and the 61.8% Fibonacci retracement level of March-April downside, near 1.3655, will be important to challenge the Loonie pair buyers.
Should the USD/CAD bulls manage to keep the reins past 1.3655, the odds of witnessing a gradual rally towards the late March swing high of 1.3804 and then to the yearly high marked in March surrounding 1.3860 can’t be ruled out.
Trend: Limited downside expected
Technical Levels: Supports and Resistances
USDCAD currently trading at 1.3554 at the time of writing. Pair opened at 1.3552 and is trading with a change of 0.01% % .
| Overview | Overview.1 | |
|---|---|---|
| 0 | Today last price | 1.3554 |
| 1 | Today Daily Change | 0.0002 |
| 2 | Today Daily Change % | 0.01% |
| 3 | Today daily open | 1.3552 |
The pair is trading above its 20 Daily moving average @ 1.3484, below its 50 Daily moving average @ 1.3585 , above its 100 Daily moving average @ 1.3527 and above its 200 Daily moving average @ 1.3429
| Trends | Trends.1 | |
|---|---|---|
| 0 | Daily SMA20 | 1.3484 |
| 1 | Daily SMA50 | 1.3585 |
| 2 | Daily SMA100 | 1.3527 |
| 3 | Daily SMA200 | 1.3429 |
The previous day high was 1.3668 while the previous day low was 1.3536. The daily 38.2% Fib levels comes at 1.3586, expected to provide resistance. Similarly, the daily 61.8% fib level is at 1.3618, expected to provide resistance.
Note the levels of interest below:
- Pivot support is noted at 1.3502, 1.3453, 1.3371
- Pivot resistance is noted at 1.3634, 1.3717, 1.3766
| Levels | Levels.1 |
|---|---|
| Previous Daily High | 1.3668 |
| Previous Daily Low | 1.3536 |
| Previous Weekly High | 1.3668 |
| Previous Weekly Low | 1.3523 |
| Previous Monthly High | 1.3668 |
| Previous Monthly Low | 1.3301 |
| Daily Fibonacci 38.2% | 1.3586 |
| Daily Fibonacci 61.8% | 1.3618 |
| Daily Pivot Point S1 | 1.3502 |
| Daily Pivot Point S2 | 1.3453 |
| Daily Pivot Point S3 | 1.3371 |
| Daily Pivot Point R1 | 1.3634 |
| Daily Pivot Point R2 | 1.3717 |
| Daily Pivot Point R3 | 1.3766 |
[/s2If]
Nehcap Expert Advisor
The NEHCAP MT4 EA is high quality professional trading system geared to generate returns without using GRID or martingales. Each trade has strict risk per trade parameter. The pairs under management include EURUSD, GBPUSD, AUDCAD, AUDNZD,GBPAUD, EURAUD, EURCAD, CHFJPY and many more.
The system is trading live: LIVE ACCOUNT TRACKING
You can run it free. Apply for a free trial and track our account. Buy the system or use profit share mechanism to generate returns on your MT4.
Join Our Telegram Group
")


