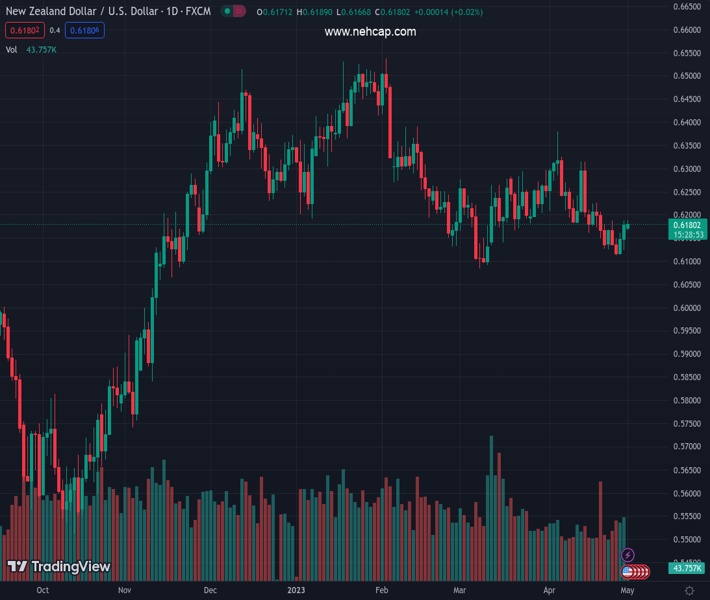
#NZDUSD @ 0.61826 grinds near intraday high during three-day uptrend. (Pivot Orderbook analysis)
…
This is a premium post.
[s2If !current_user_can(access_s2member_level4)]Please register for FREE REGISTER to read full post below containing analysis. In case of any error or you think you are not able to read the full post below, please email us at support#nehcap.com [lwa][/s2If] [s2If current_user_can(access_s2member_level1)]
- NZD/USD grinds near intraday high during three-day uptrend.
- RBNZ rules out challenges to NZ banks from higher rates, NZ PM will meet British counterpart for FTA deal.
- Hawkish Fed bets, First Republic bank induced challenges to risk prod Kiwi pair buyers.
- New Zealand jobs report, US NFP appear the key data to watch for clear direction.
The pair currently trades last at 0.61826.
The previous day high was 0.6189 while the previous day low was 0.6124. The daily 38.2% Fib levels comes at 0.6164, expected to provide support. Similarly, the daily 61.8% fib level is at 0.6149, expected to provide support.
NZD/USD clings to mild gains around 0.6180 as the Kiwi pair buyers cheer upbeat catalysts at home while struggling with the US Dollar strength during early Monday.
The Kiwi pair’s latest gains could be linked to the Reserve Bank of New Zealand’s (RBNZ) latest commentary to defend the rate hikes. Also positive for the NZD/USD bulls are the hopes of a Free Trade Agreement (FTA) between New Zealand (NZ) and the UK as NZ PM Chris Hipkins recently announced he will meet his UK counterpart Rishi Sunak at 10 Downing Street this week to advance the two countries’ FTA.
The policymaker also said, “It’s estimated the FTA will see New Zealand goods exports to the UK increase by over 50 percent, boost New Zealand’s annual GDP by up to $1 billion and save approximately $37 million per year on tariff elimination from day one.”
On the other hand, the RBNZ released an excerpt of its May 2023 Financial Stability Report amid the ongoing banking fears due to the First Republic Bank’s latest fallout. The updates mentioned that banks in the country have relatively little risk from surging interest rates as they are required to hold sufficient capital to cover potential losses.
It’s worth noting, however, that the recently upbeat prints of the US Core PCE Price Index and early signals of the US inflation have propelled the hawkish Fed bets and underpinned the US Dollar’s rebound. That said, the US Dollar Index (DXY) renews its intraday high near 101.80 during a three-day uptrend as market players cheer on recently firmer US data while also rushing toward the greenback on fears emanating from the First Republic Bank.
Amid these plays, S&P 500 Futures remain directionless while the US Treasury bond yields pare the previous day’s heavy losses amid holidays in multiple markets including China, the UK, India and Europe.
Looking forward, intraday NZD/USD buyers may keep the reins ahead of the US ISM Manufacturing PMI for April. However, Wednesday’s NZ jobs report, US Federal Open Market Committee (FOMC) and Friday’s US Nonfarm Payrolls (NFP) will be crucial to watch for clear directions.
A daily closing beyond the 200-DMA and a downward-sloping resistance line from early April, now immediate support near 0.6160-55, keeps NZD/USD buyers hopeful.
Technical Levels: Supports and Resistances
NZDUSD currently trading at 0.6182 at the time of writing. Pair opened at 0.6171 and is trading with a change of 0.18% % .
| Overview | Overview.1 | |
|---|---|---|
| 0 | Today last price | 0.6182 |
| 1 | Today Daily Change | 0.0011 |
| 2 | Today Daily Change % | 0.18% |
| 3 | Today daily open | 0.6171 |
The pair is trading below its 20 Daily moving average @ 0.6211, below its 50 Daily moving average @ 0.6208 , below its 100 Daily moving average @ 0.6287 and above its 200 Daily moving average @ 0.6161
| Trends | Trends.1 | |
|---|---|---|
| 0 | Daily SMA20 | 0.6211 |
| 1 | Daily SMA50 | 0.6208 |
| 2 | Daily SMA100 | 0.6287 |
| 3 | Daily SMA200 | 0.6161 |
The previous day high was 0.6189 while the previous day low was 0.6124. The daily 38.2% Fib levels comes at 0.6164, expected to provide support. Similarly, the daily 61.8% fib level is at 0.6149, expected to provide support.
Note the levels of interest below:
- Pivot support is noted at 0.6134, 0.6096, 0.6069
- Pivot resistance is noted at 0.6199, 0.6226, 0.6264
| Levels | Levels.1 |
|---|---|
| Previous Daily High | 0.6189 |
| Previous Daily Low | 0.6124 |
| Previous Weekly High | 0.6189 |
| Previous Weekly Low | 0.6111 |
| Previous Monthly High | 0.6389 |
| Previous Monthly Low | 0.6111 |
| Daily Fibonacci 38.2% | 0.6164 |
| Daily Fibonacci 61.8% | 0.6149 |
| Daily Pivot Point S1 | 0.6134 |
| Daily Pivot Point S2 | 0.6096 |
| Daily Pivot Point S3 | 0.6069 |
| Daily Pivot Point R1 | 0.6199 |
| Daily Pivot Point R2 | 0.6226 |
| Daily Pivot Point R3 | 0.6264 |
[/s2If]
Nehcap Expert Advisor
The NEHCAP MT4 EA is high quality professional trading system geared to generate returns without using GRID or martingales. Each trade has strict risk per trade parameter. The pairs under management include EURUSD, GBPUSD, AUDCAD, AUDNZD,GBPAUD, EURAUD, EURCAD, CHFJPY and many more.
The system is trading live: LIVE ACCOUNT TRACKING
You can run it free. Apply for a free trial and track our account. Buy the system or use profit share mechanism to generate returns on your MT4.
Join Our Telegram Group
")


