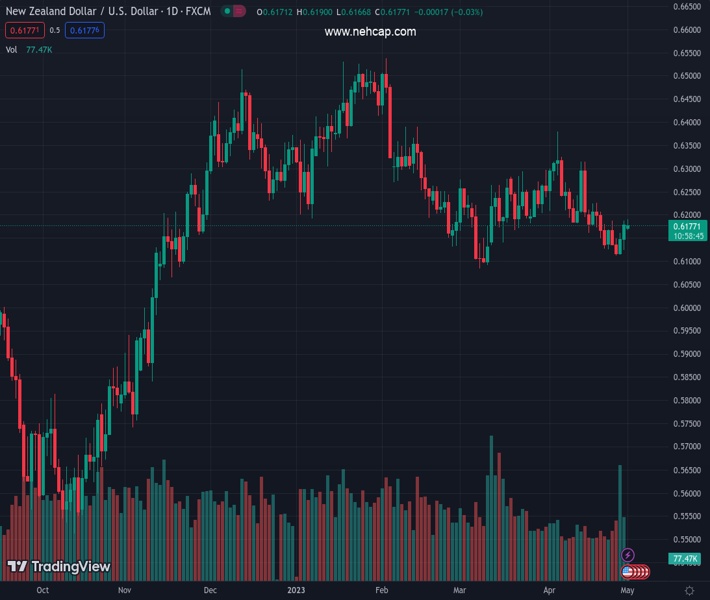
#NZDUSD @ 0.61763 lacks any firm intraday direction on Monday and oscillates in a narrow band. (Pivot Orderbook analysis)
…
This is a premium post.
[s2If !current_user_can(access_s2member_level4)]Please register for FREE REGISTER to read full post below containing analysis. In case of any error or you think you are not able to read the full post below, please email us at support#nehcap.com [lwa][/s2If] [s2If current_user_can(access_s2member_level1)]
- NZD/USD lacks any firm intraday direction on Monday and oscillates in a narrow band.
- A combination of factors pushes the USD higher and acts as a headwind for the major.
- Traders look to the US ISM PMI for some impetus ahead of the FOMC on Wednesday.
The pair currently trades last at 0.61763.
The previous day high was 0.6189 while the previous day low was 0.6124. The daily 38.2% Fib levels comes at 0.6164, expected to provide support. Similarly, the daily 61.8% fib level is at 0.6149, expected to provide support.
The NZD/USD pair struggles to capitalize on its modest uptick and seesaws between tepid gains/minor losses through the first half of trading on Monday. The pair is currently placed around the 0.6175 region, nearly unchanged for the day and just below a one-and-half-week high touched during the Asian session.
The prospects for further interest rate hikes by the Federal Reserve (Fed), along with looming recession risks, help the US Dollar (USD) to gain traction for the third successive day and turn out to be a key factor capping gains for the NZD/USD pair. In fact, the markets have fully priced in another 25 bps lift-off at the end of the highly-anticipated two-day FOMC policy meeting on Wednesday. Furthermore, weaker Chinese manufacturing data released on Sunday weigh on investors’ sentiment and benefits the safe-haven Greenback.
In fact, the official Chinese Manufacturing Purchasing Managers’ Index (PMI), released on Sunday, declined to 49.2 in April from 51.9 in March. The data comes on the back of the Advance US GDP report last week, which showed that growth in the world’s largest economy decelerated at a faster-than-expected pace during the first quarter, and adds to worries about economic headwinds stemming from rising borrowing costs. This, in turn, drives some haven flows towards the buck and contributes to keeping a lid on the NZD/USD pair.
The markets, meanwhile, seem convinced that the US central bank will hold rates steady for the rest of the year beyond May, which is holding back the USD bulls from placing aggressive bets and lending some support to the NZD/USD pair. Traders also prefer to wait on the sidelines ahead of the key central bank event risk. In the meantime, Monday’s release of the US ISM Manufacturing PMI, along with the broader risk sentiment, might influence the USD price dynamics and produce short-term trading opportunities around the major.
Technical Levels: Supports and Resistances
NZDUSD currently trading at 0.6178 at the time of writing. Pair opened at 0.6171 and is trading with a change of 0.11 % .
| Overview | Overview.1 | |
|---|---|---|
| 0 | Today last price | 0.6178 |
| 1 | Today Daily Change | 0.0007 |
| 2 | Today Daily Change % | 0.1100 |
| 3 | Today daily open | 0.6171 |
The pair is trading below its 20 Daily moving average @ 0.6211, below its 50 Daily moving average @ 0.6208 , below its 100 Daily moving average @ 0.6287 and above its 200 Daily moving average @ 0.6161
| Trends | Trends.1 | |
|---|---|---|
| 0 | Daily SMA20 | 0.6211 |
| 1 | Daily SMA50 | 0.6208 |
| 2 | Daily SMA100 | 0.6287 |
| 3 | Daily SMA200 | 0.6161 |
The previous day high was 0.6189 while the previous day low was 0.6124. The daily 38.2% Fib levels comes at 0.6164, expected to provide support. Similarly, the daily 61.8% fib level is at 0.6149, expected to provide support.
Note the levels of interest below:
- Pivot support is noted at 0.6134, 0.6096, 0.6069
- Pivot resistance is noted at 0.6199, 0.6226, 0.6264
| Levels | Levels.1 |
|---|---|
| Previous Daily High | 0.6189 |
| Previous Daily Low | 0.6124 |
| Previous Weekly High | 0.6189 |
| Previous Weekly Low | 0.6111 |
| Previous Monthly High | 0.6389 |
| Previous Monthly Low | 0.6111 |
| Daily Fibonacci 38.2% | 0.6164 |
| Daily Fibonacci 61.8% | 0.6149 |
| Daily Pivot Point S1 | 0.6134 |
| Daily Pivot Point S2 | 0.6096 |
| Daily Pivot Point S3 | 0.6069 |
| Daily Pivot Point R1 | 0.6199 |
| Daily Pivot Point R2 | 0.6226 |
| Daily Pivot Point R3 | 0.6264 |
[/s2If]
Nehcap Expert Advisor
The NEHCAP MT4 EA is high quality professional trading system geared to generate returns without using GRID or martingales. Each trade has strict risk per trade parameter. The pairs under management include EURUSD, GBPUSD, AUDCAD, AUDNZD,GBPAUD, EURAUD, EURCAD, CHFJPY and many more.
The system is trading live: LIVE ACCOUNT TRACKING
You can run it free. Apply for a free trial and track our account. Buy the system or use profit share mechanism to generate returns on your MT4.
Join Our Telegram Group
")


