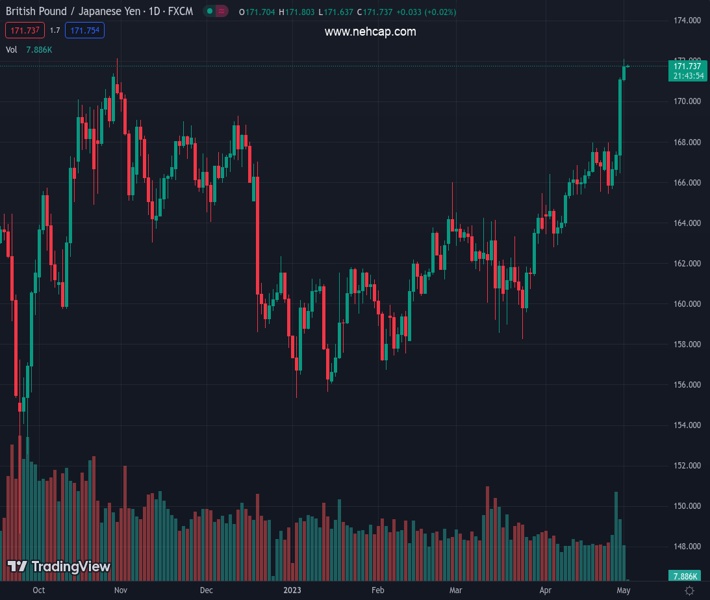
#GBPJPY @ 171.739 tests last year’s high at 172.13, as oscillators turned overbought. (Pivot Orderbook analysis)
…
This is a premium post.
[s2If !current_user_can(access_s2member_level4)]Please register for FREE REGISTER to read full post below containing analysis. In case of any error or you think you are not able to read the full post below, please email us at support#nehcap.com [lwa][/s2If] [s2If current_user_can(access_s2member_level1)]
- GBP/JPY tests last year’s high at 172.13, as oscillators turned overbought.
- The GBP/JPY first resistance is at 172.00, next target is at 172.09.
- A bearish engulfing candle pattern could exacerbate GBP/JPY fall.
The pair currently trades last at 171.739.
The previous day high was 171.18 while the previous day low was 166.49. The daily 38.2% Fib levels comes at 169.39, expected to provide support. Similarly, the daily 61.8% fib level is at 168.28, expected to provide support.
The GBP/JPY surged and tested the last year’s high at around 172.13, though it retraced slightly and remained below the 172.00 mark. As the Asian session starts, the GBP/JPY is trading at 171.74, posting minuscule gains of 0.02%.
The daily GBP/JPY chart portrays the pair in a solid uptrend, though the cross-currency pair fell shy of reaching the last year’s high. However, oscillators like the Relative Strength Index (RSI) indicator are overbought. Meanwhile, the Rate of Change (RoC) shows buyers remain in charge. But it should be said that when the RoC reached current levels twice, it was followed by some pullbacks before continuing the uptrend.
If GBP/JPY breaks 172.00, the next resistance would be the YTD high at 172.09. A breach of the latter will expose the last year’s high at 172.13, followed by the 173.00 figure.
Conversely, if the GBP/JPY registers a bearish engulfing candle pattern, that would exacerbate a fall toward the 20-day EMA at 167.22. But firstly, the GBP/JPY pair must cross below the 170.00 figure. Once cleared, the next demand area defended by buyers will be December’s 13 swing high turned support at 169.27 before testing 169.00. A breach of the latter will expose the 20-day EMA at 167.22.
Technical Levels: Supports and Resistances
GBPJPY currently trading at 171.71 at the time of writing. Pair opened at 171.17 and is trading with a change of 0.32 % .
| Overview | Overview.1 | |
|---|---|---|
| 0 | Today last price | 171.71 |
| 1 | Today Daily Change | 0.54 |
| 2 | Today Daily Change % | 0.32 |
| 3 | Today daily open | 171.17 |
The pair remains strongly bullish on the daily timeframe. It trades above its 20 SMA @ 166.19, 50 SMA 163.93, 100 SMA @ 162.27 and 200 SMA @ 163.36.
| Trends | Trends.1 | |
|---|---|---|
| 0 | Daily SMA20 | 166.19 |
| 1 | Daily SMA50 | 163.93 |
| 2 | Daily SMA100 | 162.27 |
| 3 | Daily SMA200 | 163.36 |
The previous day high was 171.18 while the previous day low was 166.49. The daily 38.2% Fib levels comes at 169.39, expected to provide support. Similarly, the daily 61.8% fib level is at 168.28, expected to provide support.
Note the levels of interest below:
- Pivot support is noted at 168.04, 164.92, 163.35
- Pivot resistance is noted at 172.74, 174.3, 177.43
| Levels | Levels.1 |
|---|---|
| Previous Daily High | 171.18 |
| Previous Daily Low | 166.49 |
| Previous Weekly High | 171.18 |
| Previous Weekly Low | 165.43 |
| Previous Monthly High | 171.18 |
| Previous Monthly Low | 162.78 |
| Daily Fibonacci 38.2% | 169.39 |
| Daily Fibonacci 61.8% | 168.28 |
| Daily Pivot Point S1 | 168.04 |
| Daily Pivot Point S2 | 164.92 |
| Daily Pivot Point S3 | 163.35 |
| Daily Pivot Point R1 | 172.74 |
| Daily Pivot Point R2 | 174.30 |
| Daily Pivot Point R3 | 177.43 |
[/s2If]
Nehcap Expert Advisor
The NEHCAP MT4 EA is high quality professional trading system geared to generate returns without using GRID or martingales. Each trade has strict risk per trade parameter. The pairs under management include EURUSD, GBPUSD, AUDCAD, AUDNZD,GBPAUD, EURAUD, EURCAD, CHFJPY and many more.
The system is trading live: LIVE ACCOUNT TRACKING
You can run it free. Apply for a free trial and track our account. Buy the system or use profit share mechanism to generate returns on your MT4.
Join Our Telegram Group
")


