#EURUSD @ 1.09663 dips as ISM Manufacturing PMI for April shows improvement but falls short of expansionary territory. (Pivot Orderbook analysis)
…
This is a premium post.
[s2If !current_user_can(access_s2member_level4)]Please register for FREE REGISTER to read full post below containing analysis. In case of any error or you think you are not able to read the full post below, please email us at support#nehcap.com [lwa][/s2If] [s2If current_user_can(access_s2member_level1)]
- EUR/USD dips as ISM Manufacturing PMI for April shows improvement but falls short of expansionary territory.
- IMF Chief Downplays de-dollarization concerns amid banking sector vulnerabilities.
- EU Inflation Figures and HCOB Manufacturing PMI to provide insight on the European Central Bank’s chances for a 50 or 25 bps rate hike.
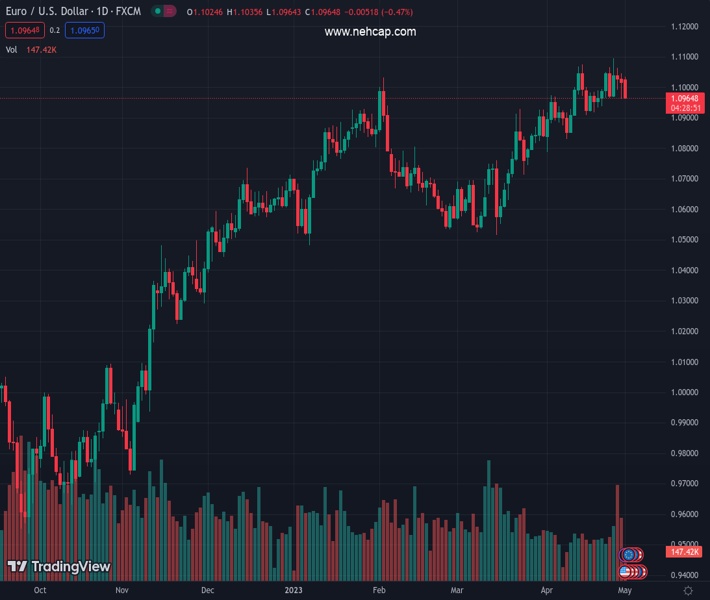
The pair currently trades last at 1.09663.
The previous day high was 1.1045 while the previous day low was 1.0962. The daily 38.2% Fib levels comes at 1.0994, expected to provide resistance. Similarly, the daily 61.8% fib level is at 1.1014, expected to provide resistance.
The EUR/USD dropped below 1.1000 after the ISM announced that manufacturing activity in April improved. However, it stood in contractionary territory, while a measure of inflation in the same data increased. Therefore, speculations for further tightening by the Federal Reserve (Fed) underpinned the US Dollar (USD). At the time of writing, the EUR/USD is trading at 1.0969 after hitting a high of 1.1035.
A risk-on impulse dominates the US equity markets, courtesy of JP Morgan’s acquiring the troubled First Republic Bank. However, that’s not happening in the FX space, as the EUR/USD fell after the ISM Manufacturing PMI for April improved to 47.1 from 46.3 in the prior’s month. While there were improvements in the Orders and Production subcomponents, they fell short of reaching expansionary territory. The Prices Index increased by 4 points to 53.2, which led to speculation that the Federal Reserve might implement tighter monetary policies in the upcoming Wednesday.
Therefore, the EUR/USD retraced, past the daily pivot point and beneath the S1 daily pivot, at 1.0970. It should be said that the greenback underpinned by higher US T-bond yields, its printing losses of 0.46%, up at 102.149.
As of writing, comments from the IMF Managing Director Kristalina Georgieva on Monday said, “De-dollarization isn’t on top of my worry list.” She added, “There may be more vulnerabilities exposed in the banking sector,” and warned that they would see quite a lot of regulatory and disclosure thinking in the wake of the banking crisis.
An absent Eurozone’s (EU) economic docket kept EUR/USD traders leaning on the American Dollar (USD) dynamics and market sentiment. On Tuesday, the EU’s agenda will feature inflation figures and the HCOB Manufacturing PMI in its final reading. The US economic calendar would feature the JOLTs Job Openings report and Factory Orders ahead of Wednesday’s Federal Reserve monetary policy decision.
From a technical perspective, the EUR/USD is still upward biased but about to test the 20-day EMA at 1.0955. A fall below the latter will expose the 1.0900 figure, followed by the 50-day EMA at 1.0856. Conversely, if EUR/USD buyers reclaim 1.1000, further upside is warranted at around 1.1095.
Technical Levels: Supports and Resistances
EURUSD currently trading at 1.0965 at the time of writing. Pair opened at 1.1019 and is trading with a change of -0.49 % .
| Overview | Overview.1 | |
|---|---|---|
| 0 | Today last price | 1.0965 |
| 1 | Today Daily Change | -0.0054 |
| 2 | Today Daily Change % | -0.4900 |
| 3 | Today daily open | 1.1019 |
The pair is trading below its 20 Daily moving average @ 1.0965, above its 50 Daily moving average @ 1.0799 , above its 100 Daily moving average @ 1.0762 and above its 200 Daily moving average @ 1.0414
| Trends | Trends.1 | |
|---|---|---|
| 0 | Daily SMA20 | 1.0965 |
| 1 | Daily SMA50 | 1.0799 |
| 2 | Daily SMA100 | 1.0762 |
| 3 | Daily SMA200 | 1.0414 |
The previous day high was 1.1045 while the previous day low was 1.0962. The daily 38.2% Fib levels comes at 1.0994, expected to provide resistance. Similarly, the daily 61.8% fib level is at 1.1014, expected to provide resistance.
Note the levels of interest below:
- Pivot support is noted at 1.0973, 1.0926, 1.089
- Pivot resistance is noted at 1.1055, 1.1092, 1.1138
| Levels | Levels.1 |
|---|---|
| Previous Daily High | 1.1045 |
| Previous Daily Low | 1.0962 |
| Previous Weekly High | 1.1095 |
| Previous Weekly Low | 1.0962 |
| Previous Monthly High | 1.1095 |
| Previous Monthly Low | 1.0788 |
| Daily Fibonacci 38.2% | 1.0994 |
| Daily Fibonacci 61.8% | 1.1014 |
| Daily Pivot Point S1 | 1.0973 |
| Daily Pivot Point S2 | 1.0926 |
| Daily Pivot Point S3 | 1.0890 |
| Daily Pivot Point R1 | 1.1055 |
| Daily Pivot Point R2 | 1.1092 |
| Daily Pivot Point R3 | 1.1138 |
[/s2If]
Nehcap Expert Advisor
The NEHCAP MT4 EA is high quality professional trading system geared to generate returns without using GRID or martingales. Each trade has strict risk per trade parameter. The pairs under management include EURUSD, GBPUSD, AUDCAD, AUDNZD,GBPAUD, EURAUD, EURCAD, CHFJPY and many more.
The system is trading live: LIVE ACCOUNT TRACKING
You can run it free. Apply for a free trial and track our account. Buy the system or use profit share mechanism to generate returns on your MT4.
Join Our Telegram Group
")


