#XAUUSD @ 1,988.65 Gold price is inside the woods as investors are awaiting the Fed policy announcement for further guidance. (Pivot Orderbook analysis)
…
This is a premium post.
[s2If !current_user_can(access_s2member_level4)]Please register for FREE REGISTER to read full post below containing analysis. In case of any error or you think you are not able to read the full post below, please email us at support#nehcap.com [lwa][/s2If] [s2If current_user_can(access_s2member_level1)]
- Gold price is inside the woods as investors are awaiting the Fed policy announcement for further guidance.
- The USD Index slipped firmly from 102.17 despite the upbeat Employment Cost Index and consistency in consumer spending.
- Lengthy consolidation in the Gold price would be followed by wider ticks and heavy volume after an explosion
The pair currently trades last at 1988.65.
The previous day high was 1995.07 while the previous day low was 1976.28. The daily 38.2% Fib levels comes at 1987.89, expected to provide support. Similarly, the daily 61.8% fib level is at 1983.46, expected to provide support.
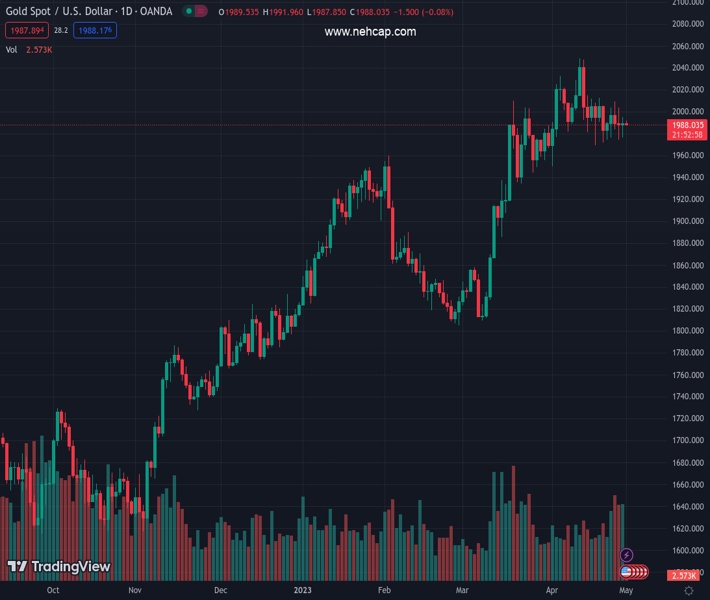
Gold price (XAU/USD) is hovering around $1,990.00 in the early Asian session. The precious metal is struggling to find any direction as investors are awaiting the announcement of the interest rate decision by the Federal Reserve (Fed). The yellow metal is bounded in a range of $1,970-2,010 from the past week as investors are anxious about knowing the importance of May’s monetary policy meeting.
S&P500 settled last week with 1% gains despite a sell-off in the initial days. After digesting renewed fears of United States banking woes investors shifted their focus on upbeat quarterly earnings from technology stocks. Also, Friday’s bullish closing portrays an upbeat market mood.
The US Dollar Index (DXY) slipped firmly from the weekly high of 102.17 on Friday despite an upbeat Employment Cost Index and consistency in consumer spending. The Labor Cost Index (Q1) jumped to 1.2% from the consensus and the former release of 1.1%. A higher labor cost index indicates that firms still offer higher wages to attract talent due to labor shortage.
Meanwhile, the monthly core Personal Consumption Expenditure (PCE) Price Index remained consistent with estimates and former acceleration at 0.3%. The preferred tool of the Fed to judge the overall context of inflationary pressures in the US economy landed at 4.6% higher than expectations of 4.5% but lower than the former release of 4.7% on an annual basis, indicating stubbornness in core inflation.
Gold price is inside the woods from the past week in a range of $1,969-2,014 on a four-hour scale. Lengthy consolidation indicates a sheer volatility contraction, which is expected to be followed by wider ticks and heavy volume after an explosion.
Advancing trendline from March 22 low at $1,934.34 is acting as a cushion for the Gold bulls.
The 20-period Exponential Moving Average (EMA) at $1,990.15 is continuously hovering around the Gold price, hinting at a sideways performance.
Also, the Relative Strength Index (RSI) (14) is oscillating in the 40.00-60.00 range, indicating an absence of a critical trigger.
Technical Levels: Supports and Resistances
XAUUSD currently trading at 1989.92 at the time of writing. Pair opened at 1989.92 and is trading with a change of 0.0 % .
| Overview | Overview.1 | |
|---|---|---|
| 0 | Today last price | 1989.92 |
| 1 | Today Daily Change | 0.00 |
| 2 | Today Daily Change % | 0.00 |
| 3 | Today daily open | 1989.92 |
The pair is trading below its 20 Daily moving average @ 1999.67, above its 50 Daily moving average @ 1933.99 , above its 100 Daily moving average @ 1897.52 and above its 200 Daily moving average @ 1807.42
| Trends | Trends.1 | |
|---|---|---|
| 0 | Daily SMA20 | 1999.67 |
| 1 | Daily SMA50 | 1933.99 |
| 2 | Daily SMA100 | 1897.52 |
| 3 | Daily SMA200 | 1807.42 |
The previous day high was 1995.07 while the previous day low was 1976.28. The daily 38.2% Fib levels comes at 1987.89, expected to provide support. Similarly, the daily 61.8% fib level is at 1983.46, expected to provide support.
Note the levels of interest below:
- Pivot support is noted at 1979.11, 1968.3, 1960.32
- Pivot resistance is noted at 1997.9, 2005.88, 2016.69
| Levels | Levels.1 |
|---|---|
| Previous Daily High | 1995.07 |
| Previous Daily Low | 1976.28 |
| Previous Weekly High | 2009.41 |
| Previous Weekly Low | 1974.13 |
| Previous Monthly High | 2009.88 |
| Previous Monthly Low | 1809.46 |
| Daily Fibonacci 38.2% | 1987.89 |
| Daily Fibonacci 61.8% | 1983.46 |
| Daily Pivot Point S1 | 1979.11 |
| Daily Pivot Point S2 | 1968.30 |
| Daily Pivot Point S3 | 1960.32 |
| Daily Pivot Point R1 | 1997.90 |
| Daily Pivot Point R2 | 2005.88 |
| Daily Pivot Point R3 | 2016.69 |
[/s2If]
Nehcap Expert Advisor
The NEHCAP MT4 EA is high quality professional trading system geared to generate returns without using GRID or martingales. Each trade has strict risk per trade parameter. The pairs under management include EURUSD, GBPUSD, AUDCAD, AUDNZD,GBPAUD, EURAUD, EURCAD, CHFJPY and many more.
The system is trading live: LIVE ACCOUNT TRACKING
You can run it free. Apply for a free trial and track our account. Buy the system or use profit share mechanism to generate returns on your MT4.
Join Our Telegram Group
")


