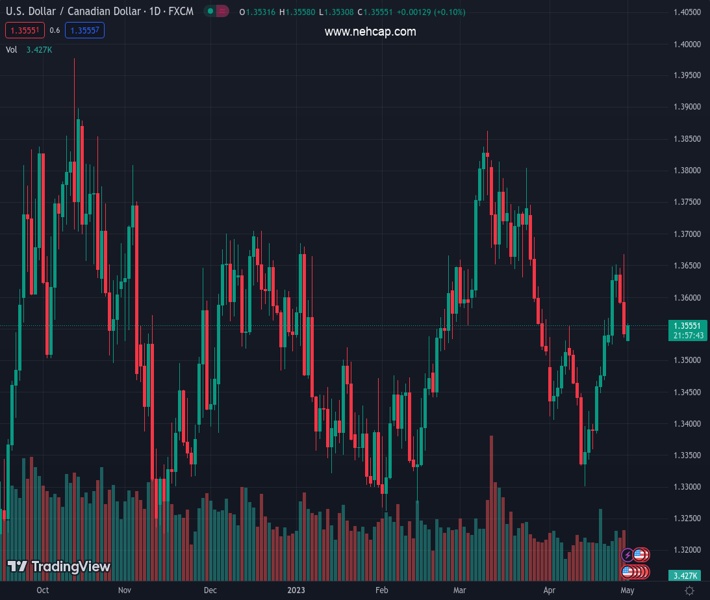
#USDCAD @ 1.35500 has found short-term support below 1.3550 after a vertical sell-off. (Pivot Orderbook analysis)
…
This is a premium post.
[s2If !current_user_can(access_s2member_level4)]Please register for FREE REGISTER to read full post below containing analysis. In case of any error or you think you are not able to read the full post below, please email us at support#nehcap.com [lwa][/s2If] [s2If current_user_can(access_s2member_level1)]
- USD/CAD has found short-term support below 1.3550 after a vertical sell-off.
- A power-pack action is anticipated amid the release of US/Canada Manufacturing PMI figures.
- USD/CAD has slipped significantly after facing immense selling pressure from 61.8% Fibo retracement.
The pair currently trades last at 1.35500.
The previous day high was 1.3668 while the previous day low was 1.3536. The daily 38.2% Fib levels comes at 1.3586, expected to provide resistance. Similarly, the daily 61.8% fib level is at 1.3618, expected to provide resistance.
The USD/CAD pair has gauged an intermediate cushion below 1.3550 after a vertical sell-off from the weekly high of 1.3668. The Loonie asset is building a base ahead of the Manufacturing PMI data from Canada and the United States ahead.
S&P500 settled Friday’s session on a bullish note as consistent consumer spending and upbeat quarterly figures from technology stocks infused confidence in investors. Investors could show some traits of pre-Federal Reserve (Fed) policy anxiety ahead.
The US Dollar Index (DXY) has rebounded after dropping to near 101.50 and is looking to extend its recovery above 101.70 as the Fed is expected to raise interest rates one more time by 25 basis points (bps).
USD/CAD has slipped significantly after facing immense selling pressure from 61.8% Fibonacci retracement (placed from March 10 high at 1.3862 to April 14 low at 1.3301) at 1.3650 on a four-hour scale. It seems that the strength in the selling pressure was extremely high as it dragged the Loonie asset sharply below the 20-and 50-period Exponential Moving Averages (EMAs) at 1.3590 and 1.3566 respectively.
Meanwhile, the Relative Strength Index (RSI) (14) has shifted into the 40.00-60.00 range from the bullish range of 60.00-80.00. The RSI (14) is struggling to maintain the 40.00 support as a break below the same will strengthen the Canadian Dollar.
Going forward, a decisive break below the intraday low at 1.3533 will expose the asset to psychological support at 1.3500 followed by a 23.6% Fibo retracement at 1.3438.
On the flip side, a recovery move above the 61.8% Fibo retracement at 1.3650 will trigger a reversal and will drive the major toward the round-level resistance at 1.3700. A break above the same will expose the asset to March 22 high at 1.3745.
Technical Levels: Supports and Resistances
USDCAD currently trading at 1.3552 at the time of writing. Pair opened at 1.3552 and is trading with a change of -0.0 % .
| Overview | Overview.1 | |
|---|---|---|
| 0 | Today last price | 1.3552 |
| 1 | Today Daily Change | 0.0000 |
| 2 | Today Daily Change % | -0.0000 |
| 3 | Today daily open | 1.3552 |
The pair is trading above its 20 Daily moving average @ 1.3484, below its 50 Daily moving average @ 1.3585 , above its 100 Daily moving average @ 1.3527 and above its 200 Daily moving average @ 1.3429
| Trends | Trends.1 | |
|---|---|---|
| 0 | Daily SMA20 | 1.3484 |
| 1 | Daily SMA50 | 1.3585 |
| 2 | Daily SMA100 | 1.3527 |
| 3 | Daily SMA200 | 1.3429 |
The previous day high was 1.3668 while the previous day low was 1.3536. The daily 38.2% Fib levels comes at 1.3586, expected to provide resistance. Similarly, the daily 61.8% fib level is at 1.3618, expected to provide resistance.
Note the levels of interest below:
- Pivot support is noted at 1.3502, 1.3453, 1.3371
- Pivot resistance is noted at 1.3634, 1.3717, 1.3766
| Levels | Levels.1 |
|---|---|
| Previous Daily High | 1.3668 |
| Previous Daily Low | 1.3536 |
| Previous Weekly High | 1.3668 |
| Previous Weekly Low | 1.3523 |
| Previous Monthly High | 1.3862 |
| Previous Monthly Low | 1.3508 |
| Daily Fibonacci 38.2% | 1.3586 |
| Daily Fibonacci 61.8% | 1.3618 |
| Daily Pivot Point S1 | 1.3502 |
| Daily Pivot Point S2 | 1.3453 |
| Daily Pivot Point S3 | 1.3371 |
| Daily Pivot Point R1 | 1.3634 |
| Daily Pivot Point R2 | 1.3717 |
| Daily Pivot Point R3 | 1.3766 |
[/s2If]
Nehcap Expert Advisor
The NEHCAP MT4 EA is high quality professional trading system geared to generate returns without using GRID or martingales. Each trade has strict risk per trade parameter. The pairs under management include EURUSD, GBPUSD, AUDCAD, AUDNZD,GBPAUD, EURAUD, EURCAD, CHFJPY and many more.
The system is trading live: LIVE ACCOUNT TRACKING
You can run it free. Apply for a free trial and track our account. Buy the system or use profit share mechanism to generate returns on your MT4.
Join Our Telegram Group
")


