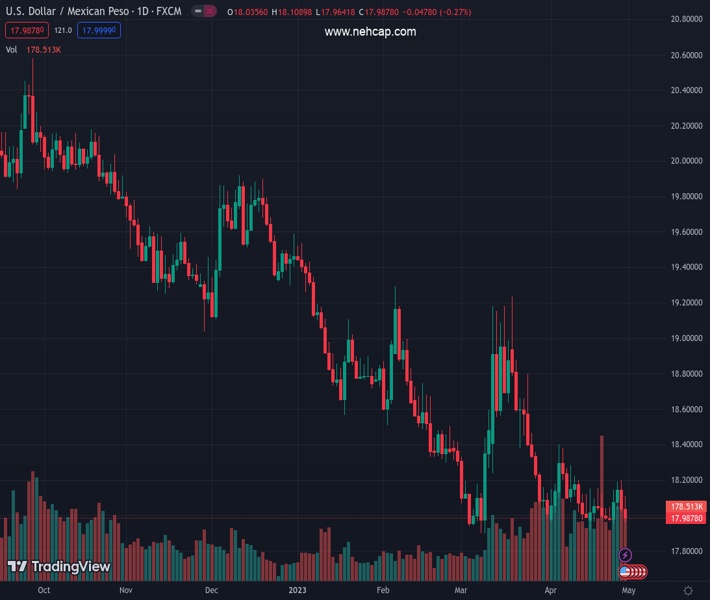
#USDMXN @ 17.9858 to finish the week almost flat, with gains of 0.70%. (Pivot Orderbook analysis)
…
This is a premium post.
[s2If !current_user_can(access_s2member_level4)]Please register for FREE REGISTER to read full post below containing analysis. In case of any error or you think you are not able to read the full post below, please email us at support#nehcap.com [lwa][/s2If] [s2If current_user_can(access_s2member_level1)]
- USD/MXN to finish the week almost flat, with gains of 0.70%.
- Data from the United States justified a 25 bps hike by the Fed at the May meeting, though it did not boost the US Dollar.
- USD/MXN Price Analysis: Downward pressured below 18.00; otherwise, expect a rally to the 20-DMA at 18.10000.
The pair currently trades last at 17.9858.
The previous day high was 18.2 while the previous day low was 18.0182. The daily 38.2% Fib levels comes at 18.0877, expected to provide resistance. Similarly, the daily 61.8% fib level is at 18.1306, expected to provide resistance.
The Mexican Peso (MXN) appreciates during the last trading day of the week, as shown by the USD/MXN tumbling 0.25%, amidst a risk-on impulse due to US stocks posting solid earnings. US data flashed signs that inflation is too high, a green light for another rate increase by the Federal Reserve (Fed). At the time of writing, the USD/MXN is trading at 17.9830 after hitting a high of 18.1089.
Wall Street finished the last trading day of April with solid gains, propelled by earnings from Exxon and Intel. A report by the US Commerce Department showed that inflation in March, as measured by the Fed’s preferred gauge for inflation, the core Personal Consumption Expenditure (PCE), rose by 0.3% MoM in line with estimates. On an annual basis, figures rose by 4.6%, above forecasts of 4.5%, increasing the chances for another quarter of percent rate hike by the US central bank.
Given the backdrop, the swaps market continued to price in a 25 bps hike for the May meeting though investors remain reluctant to believe the Fed’s rhetoric of going higher for longer. The CME FEdWatch Tool odds for a 25 bps lift stood at 84%, but the first rate cut is expected by September.
In the meantime, the US Dollar Index (DXY), which tracks the value of six currencies against the greenback, advances 0.20% to 101.681 but fails to impress USD/MXN buyers as the pair extended its losses past the 18.0000 figure.
In other data, Consumer Sentiment in the US stood at 63.5, an improvement over the latest reading of 62.0, as revealed by the University of Michigan (UoM) poll. Inflation expectations for a one-year horizon rose to 4.6% from 3.6%, and expectations for a 5-year uptick to 3% from 2.9%.
On the Mexican front, the economy expanded by 1.1% QoQ, above the previous 0.5% growth in Q4, 2022, as reported by INEGI. On an annual basis, the Gross Domestic Product (GDP) grew by 3.9%, exceeding the forecasts of 3.3%.
Aside from this, USD/MXN traders would look for clues to next week’s Federal Reserve Open Market Committee (FOMC) decision on Wednesday afternoon, and the US Nonfarm Payrolls report on Friday
The downtrend in the USD/MXN pair stays intact after testing the 20-day EMA earlier in the day. However, USD/MXN sellers must drag the exchange rate below the April 25 low of 17.9505 if they want to re-test the YTD low at 17.8968. Conversely, the USD/MXN buyers must crack 18.0000 and the 20-day EMA at around 18.1000 if they want to challenge the 50-day EMA At 18.2910.
Technical Levels: Supports and Resistances
USDMXN currently trading at 17.9939 at the time of writing. Pair opened at 18.0389 and is trading with a change of -0.25 % .
| Overview | Overview.1 | |
|---|---|---|
| 0 | Today last price | 17.9939 |
| 1 | Today Daily Change | -0.0450 |
| 2 | Today Daily Change % | -0.2500 |
| 3 | Today daily open | 18.0389 |
The pair remains strongly bearish on the daily time frame. It trades below the 20 SMA @ 18.086, 50 SMA 18.2758, 100 SMA @ 18.6967 and 200 SMA @ 19.3062.
| Trends | Trends.1 | |
|---|---|---|
| 0 | Daily SMA20 | 18.0860 |
| 1 | Daily SMA50 | 18.2758 |
| 2 | Daily SMA100 | 18.6967 |
| 3 | Daily SMA200 | 19.3062 |
The previous day high was 18.2 while the previous day low was 18.0182. The daily 38.2% Fib levels comes at 18.0877, expected to provide resistance. Similarly, the daily 61.8% fib level is at 18.1306, expected to provide resistance.
Note the levels of interest below:
- Pivot support is noted at 17.9714, 17.9039, 17.7895
- Pivot resistance is noted at 18.1532, 18.2676, 18.3351
| Levels | Levels.1 |
|---|---|
| Previous Daily High | 18.2000 |
| Previous Daily Low | 18.0182 |
| Previous Weekly High | 18.1542 |
| Previous Weekly Low | 17.9329 |
| Previous Monthly High | 19.2324 |
| Previous Monthly Low | 17.8977 |
| Daily Fibonacci 38.2% | 18.0877 |
| Daily Fibonacci 61.8% | 18.1306 |
| Daily Pivot Point S1 | 17.9714 |
| Daily Pivot Point S2 | 17.9039 |
| Daily Pivot Point S3 | 17.7895 |
| Daily Pivot Point R1 | 18.1532 |
| Daily Pivot Point R2 | 18.2676 |
| Daily Pivot Point R3 | 18.3351 |
[/s2If]
Nehcap Expert Advisor
The NEHCAP MT4 EA is high quality professional trading system geared to generate returns without using GRID or martingales. Each trade has strict risk per trade parameter. The pairs under management include EURUSD, GBPUSD, AUDCAD, AUDNZD,GBPAUD, EURAUD, EURCAD, CHFJPY and many more.
The system is trading live: LIVE ACCOUNT TRACKING
You can run it free. Apply for a free trial and track our account. Buy the system or use profit share mechanism to generate returns on your MT4.
Join Our Telegram Group
")


