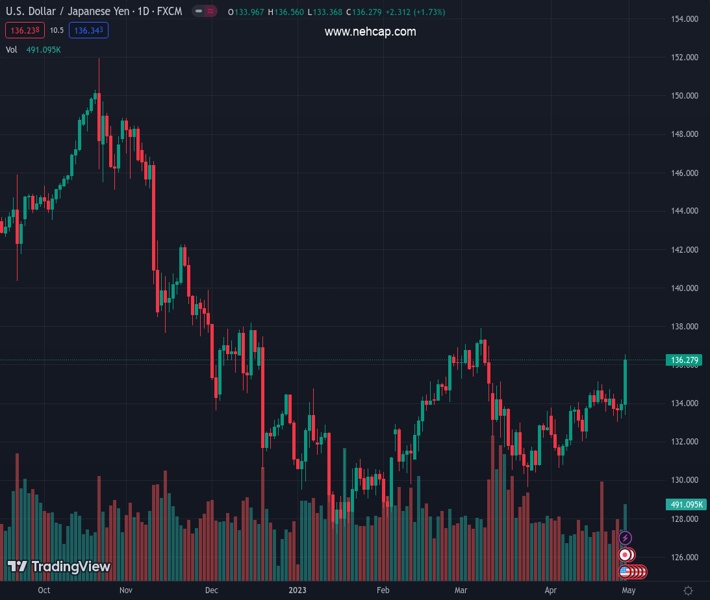
#USDJPY @ 136.325 skyrocketed after BoJ’s dovish decision and high US core PCE data. (Pivot Orderbook analysis)
…
This is a premium post.
[s2If !current_user_can(access_s2member_level4)]Please register for FREE REGISTER to read full post below containing analysis. In case of any error or you think you are not able to read the full post below, please email us at support#nehcap.com [lwa][/s2If] [s2If current_user_can(access_s2member_level1)]
- USD/JPY skyrocketed after BoJ’s dovish decision and high US core PCE data.
- USD/JPY Price Analysis: Rallied more than 200 pips, set for a pullback, before challenging YTD high,
The pair currently trades last at 136.325.
The previous day high was 134.2 while the previous day low was 133.21. The daily 38.2% Fib levels comes at 133.82, expected to provide support. Similarly, the daily 61.8% fib level is at 133.59, expected to provide support.
The USD/JPY rose sharply after the first monetary policy decision by the Bank of Japan (BoJ) new Governor Kazuo Ueda struck a dovish tone, a greenlight for US Dollar (USD) buyers, against the Japanese Yen. (JPY). Therefore, the USD/JPY extended its gains of more than 1.73%, trading at 136.27.
After the US inflation data release, the USD/JPY skyrocketed, past the last week’s high of 135.13, and extended its gains toward the 136.56 area, a six-week high at 136.56.
The USD/JPY resumed its uptrend after the release of inflation data in the US. On its way north, the price jumped more than 200 pips in the day, and it had opened the door to test the YTD high at 137.91. Nevertheless, buyers must reclaim some resistance levels before challenging the YTD high.
The first resistance would be the March 10 high at 136.99, which, once cleared, the USD/JPY will continue towards the March 9 high at 137.35. Up next would be the YTD high before testing 138.00.
On the other hand, the aggressive rally lifted the Relative Strength Index (RSI) indicator shy of reaching the overbought level; while the Rate of Change (RoC) hit levels last seen on February 15. Given the backdrop, the USD/JPY might be headed for a pullback after Friday’s rally.
The USD/JPY first support would be 136.00, followed by the 135.50 area. A breach of the latter, the USD/JPY could dip toward April 19 daily high, turned support at 135.13, ahead of challenging the 135.00 figure.
Technical Levels: Supports and Resistances
USDJPY currently trading at 136.31 at the time of writing. Pair opened at 133.95 and is trading with a change of 1.76 % .
| Overview | Overview.1 | |
|---|---|---|
| 0 | Today last price | 136.31 |
| 1 | Today Daily Change | 2.36 |
| 2 | Today Daily Change % | 1.76 |
| 3 | Today daily open | 133.95 |
The pair is trading above its 20 Daily moving average @ 133.32, above its 50 Daily moving average @ 133.79 , above its 100 Daily moving average @ 132.89 and below its 200 Daily moving average @ 136.99
| Trends | Trends.1 | |
|---|---|---|
| 0 | Daily SMA20 | 133.32 |
| 1 | Daily SMA50 | 133.79 |
| 2 | Daily SMA100 | 132.89 |
| 3 | Daily SMA200 | 136.99 |
The previous day high was 134.2 while the previous day low was 133.21. The daily 38.2% Fib levels comes at 133.82, expected to provide support. Similarly, the daily 61.8% fib level is at 133.59, expected to provide support.
Note the levels of interest below:
- Pivot support is noted at 133.37, 132.8, 132.39
- Pivot resistance is noted at 134.36, 134.77, 135.34
| Levels | Levels.1 |
|---|---|
| Previous Daily High | 134.20 |
| Previous Daily Low | 133.21 |
| Previous Weekly High | 135.14 |
| Previous Weekly Low | 133.55 |
| Previous Monthly High | 137.91 |
| Previous Monthly Low | 129.64 |
| Daily Fibonacci 38.2% | 133.82 |
| Daily Fibonacci 61.8% | 133.59 |
| Daily Pivot Point S1 | 133.37 |
| Daily Pivot Point S2 | 132.80 |
| Daily Pivot Point S3 | 132.39 |
| Daily Pivot Point R1 | 134.36 |
| Daily Pivot Point R2 | 134.77 |
| Daily Pivot Point R3 | 135.34 |
[/s2If]
Nehcap Expert Advisor
The NEHCAP MT4 EA is high quality professional trading system geared to generate returns without using GRID or martingales. Each trade has strict risk per trade parameter. The pairs under management include EURUSD, GBPUSD, AUDCAD, AUDNZD,GBPAUD, EURAUD, EURCAD, CHFJPY and many more.
The system is trading live: LIVE ACCOUNT TRACKING
You can run it free. Apply for a free trial and track our account. Buy the system or use profit share mechanism to generate returns on your MT4.
Join Our Telegram Group
")


