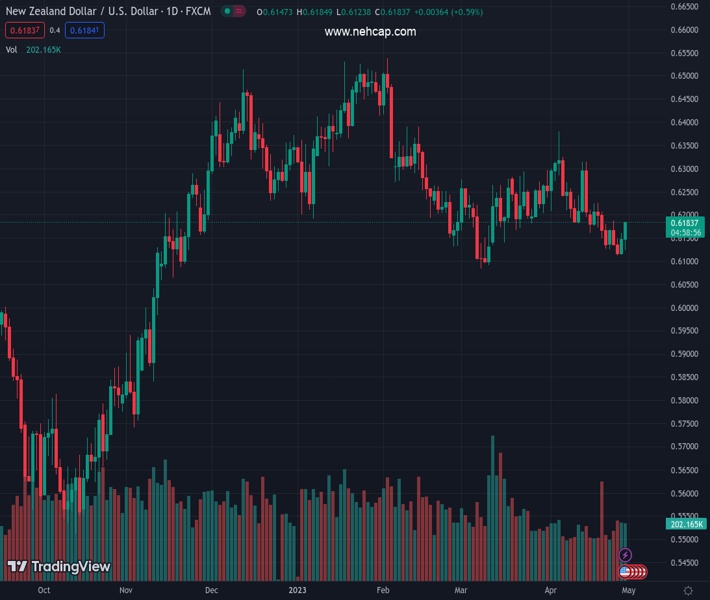
#NZDUSD @ 0.61834 breaks prior’s day high and eyes a test of the 20-day EMA at 0.6188. (Pivot Orderbook analysis)
…
This is a premium post.
[s2If !current_user_can(access_s2member_level4)]Please register for FREE REGISTER to read full post below containing analysis. In case of any error or you think you are not able to read the full post below, please email us at support#nehcap.com [lwa][/s2If] [s2If current_user_can(access_s2member_level1)]
- NZD/USD breaks prior’s day high and eyes a test of the 20-day EMA at 0.6188.
- The core PCE, the Fed’s preferred gauge for inflation, remains stickier, warranting a Fed hike at the May meeting.
- NZD/USD Price Analysis: Downtrend risks negation as NZD/USD eyes 0.6200 with 200-day EMA hovering near 0.6220s.
The pair currently trades last at 0.61834.
The previous day high was 0.6162 while the previous day low was 0.6114. The daily 38.2% Fib levels comes at 0.6144, expected to provide support. Similarly, the daily 61.8% fib level is at 0.6132, expected to provide support.
The NZD/USD extends its uptrend, hitting a three-day high at around 0.6172, as buyers see a break above technical resistance at the 20-day EMA. Although data from the United States (US) further cemented the case for a Federal Reserve (Fed) hike, the New Zealand Dollar (NZD) advances steadily. At the time of writing, the NZD/USD is trading at 0.6182.
The US Department of Commerce (DoC) revealed that inflation in the United States decelerated, with the Personal Consumption Expenditure (PCE) slowing from 5.1% to 4.2% in YoY readings, while for a monthly basis, edged to 0.1%, below the prior’s month 0.3%. Meanwhile, the Fed’s preferred gauge for inflation, the core PCE, stood at 4.6% YoY, unchanged compared to the last month’s data.
Given the backdrop, investors stood convinced that the Fed would raise rates, as shown by the CME FedWatch Tool. Odds for a 25 bps increase lie at 88.3%, above yesterday’s 83.9% chances. Nevertheless, US T-bond yields edged lower, with 2s down 3.5 bps at 4.039%, while 10s dropped 7.5 bps at 3.448%.
Another piece of the puzzle that added to inflationary pressures standing still is the Employment Cost Index (ECI) revealed by the US Department of Labor. The ECI rose from 1.1% in the previous quarter to 1.2% in Q1, 2023.
In other data, the University of Michigan (UoM) Consumer Sentiment remained unchanged at 63.5. Inflation expectations for 1-year stood at 4.6%, and for a 5-year horizon at 3%.
In the meantime, the US Dollar Index (DXY), which measures the performance of six currencies against the American Dollar (USD), has erased some of its earlier gains and remains above its opening price by 0.10%< at 101.583.
On the New Zealand front, the ANZ Roy Morgan Consumer Confidence Index improved to 79.3 in April from 77.7 in March of 2023, though it remained at low levels as people remained concerned about elevated prices
From a technical perspective, the NZD/USD is still in a downtrend though it has recovered some ground. The 20-day Exponential Moving Average (EMA) at 0.6187 would be the first resistance that buyers will test as they aim toward 0.6200. Once broke, the latter will be challenged, as the 100-day EMA at 0.6218 would appear in front of the bulls. The downtrend would be at risk at the 200-day EMA at 0.6226. On the flip side, if NZD/USD drops below the April 27 high of 0.6161, further downside is expected.
Technical Levels: Supports and Resistances
NZDUSD currently trading at 0.6177 at the time of writing. Pair opened at 0.6147 and is trading with a change of 0.49 % .
| Overview | Overview.1 | |
|---|---|---|
| 0 | Today last price | 0.6177 |
| 1 | Today Daily Change | 0.0030 |
| 2 | Today Daily Change % | 0.4900 |
| 3 | Today daily open | 0.6147 |
The pair is trading below its 20 Daily moving average @ 0.6215, below its 50 Daily moving average @ 0.621 , below its 100 Daily moving average @ 0.629 and above its 200 Daily moving average @ 0.6161
| Trends | Trends.1 | |
|---|---|---|
| 0 | Daily SMA20 | 0.6215 |
| 1 | Daily SMA50 | 0.6210 |
| 2 | Daily SMA100 | 0.6290 |
| 3 | Daily SMA200 | 0.6161 |
The previous day high was 0.6162 while the previous day low was 0.6114. The daily 38.2% Fib levels comes at 0.6144, expected to provide support. Similarly, the daily 61.8% fib level is at 0.6132, expected to provide support.
Note the levels of interest below:
- Pivot support is noted at 0.612, 0.6093, 0.6072
- Pivot resistance is noted at 0.6168, 0.6189, 0.6216
| Levels | Levels.1 |
|---|---|
| Previous Daily High | 0.6162 |
| Previous Daily Low | 0.6114 |
| Previous Weekly High | 0.6227 |
| Previous Weekly Low | 0.6126 |
| Previous Monthly High | 0.6298 |
| Previous Monthly Low | 0.6084 |
| Daily Fibonacci 38.2% | 0.6144 |
| Daily Fibonacci 61.8% | 0.6132 |
| Daily Pivot Point S1 | 0.6120 |
| Daily Pivot Point S2 | 0.6093 |
| Daily Pivot Point S3 | 0.6072 |
| Daily Pivot Point R1 | 0.6168 |
| Daily Pivot Point R2 | 0.6189 |
| Daily Pivot Point R3 | 0.6216 |
[/s2If]
Nehcap Expert Advisor
The NEHCAP MT4 EA is high quality professional trading system geared to generate returns without using GRID or martingales. Each trade has strict risk per trade parameter. The pairs under management include EURUSD, GBPUSD, AUDCAD, AUDNZD,GBPAUD, EURAUD, EURCAD, CHFJPY and many more.
The system is trading live: LIVE ACCOUNT TRACKING
You can run it free. Apply for a free trial and track our account. Buy the system or use profit share mechanism to generate returns on your MT4.
Join Our Telegram Group
")


