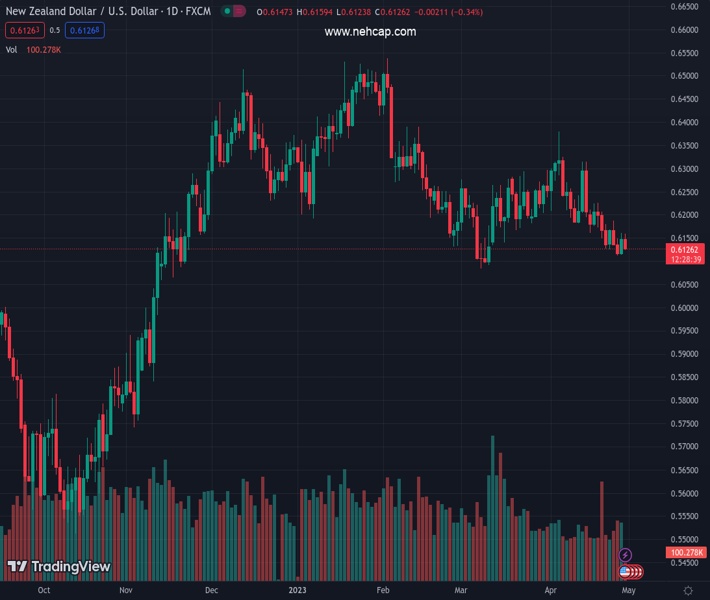
#NZDUSD @ 0.61267 edges lower on Friday and remains well within the striking distance of the monthly low. (Pivot Orderbook analysis)
…
This is a premium post.
[s2If !current_user_can(access_s2member_level4)]Please register for FREE REGISTER to read full post below containing analysis. In case of any error or you think you are not able to read the full post below, please email us at support#nehcap.com [lwa][/s2If] [s2If current_user_can(access_s2member_level1)]
- NZD/USD edges lower on Friday and remains well within the striking distance of the monthly low.
- A combination of factors lifts the USD to a fresh weekly high and exerts some pressure on the pair.
- The downside remains cushioned as traders move to the sidelines ahead of the US PCE Price Index.
The pair currently trades last at 0.61267.
The previous day high was 0.6162 while the previous day low was 0.6114. The daily 38.2% Fib levels comes at 0.6144, expected to provide resistance. Similarly, the daily 61.8% fib level is at 0.6132, expected to provide resistance.
The NZD/USD pair attracts some intraday sellers near the 0.6160 area on Friday and remains on the defensive through the early part of the European session. The pair remains well within the striking distance of its lowest level since March 10 touched earlier this week and is pressured by resurgent US Dollar (USD) demand.
In fact, the USD Index, which tracks the Greenback against a basket of currencies, touches a fresh weekly high and continues to draw support from firming expectations for another 25 bps lift-off at the next FOMC meeting in May. The bets for additional rate hikes by the US central bank were reaffirmed by the US macro data released on Thursday, which indicated persistent inflationary pressures and that the US job market remains healthy despite an economic slowdown.
The Greenback gets an additional boost from the Bank of Japan (BoJ)-inspired sell-off in the Japanese Yen (JPY). Apart from this, a softer risk tone further benefits the safe-haven buck and acts as a headwind for the risk-sensitive Kiwi. The markets, however, have been pricing in a pause in the Fed’s rate-hiking cycle after May. This, in turn, is holding back the USD bulls from placing aggressive bets and lending some support to the NZD/USD pair, at least for the time being.
Traders also seem reluctant and remain on the sidelines ahead of Friday’s release of the US Core PCE Price Index – the Fed’s preferred inflation gauge. The crucial US macro data will play a key role in influencing the near-term USD price dynamics and provide some meaningful impetus to the NZD/USD on the last day of the week. Apart from this, traders will further take cues from the broader risk sentiment to grab short-term opportunities heading into the weekend.
Technical Levels: Supports and Resistances
NZDUSD currently trading at 0.6128 at the time of writing. Pair opened at 0.6147 and is trading with a change of -0.31 % .
| Overview | Overview.1 | |
|---|---|---|
| 0 | Today last price | 0.6128 |
| 1 | Today Daily Change | -0.0019 |
| 2 | Today Daily Change % | -0.3100 |
| 3 | Today daily open | 0.6147 |
The pair remains strongly bearish on the daily time frame. It trades below the 20 SMA @ 0.6215, 50 SMA 0.621, 100 SMA @ 0.629 and 200 SMA @ 0.6161.
| Trends | Trends.1 | |
|---|---|---|
| 0 | Daily SMA20 | 0.6215 |
| 1 | Daily SMA50 | 0.6210 |
| 2 | Daily SMA100 | 0.6290 |
| 3 | Daily SMA200 | 0.6161 |
The previous day high was 0.6162 while the previous day low was 0.6114. The daily 38.2% Fib levels comes at 0.6144, expected to provide resistance. Similarly, the daily 61.8% fib level is at 0.6132, expected to provide resistance.
Note the levels of interest below:
- Pivot support is noted at 0.612, 0.6093, 0.6072
- Pivot resistance is noted at 0.6168, 0.6189, 0.6216
| Levels | Levels.1 |
|---|---|
| Previous Daily High | 0.6162 |
| Previous Daily Low | 0.6114 |
| Previous Weekly High | 0.6227 |
| Previous Weekly Low | 0.6126 |
| Previous Monthly High | 0.6298 |
| Previous Monthly Low | 0.6084 |
| Daily Fibonacci 38.2% | 0.6144 |
| Daily Fibonacci 61.8% | 0.6132 |
| Daily Pivot Point S1 | 0.6120 |
| Daily Pivot Point S2 | 0.6093 |
| Daily Pivot Point S3 | 0.6072 |
| Daily Pivot Point R1 | 0.6168 |
| Daily Pivot Point R2 | 0.6189 |
| Daily Pivot Point R3 | 0.6216 |
[/s2If]
Nehcap Expert Advisor
The NEHCAP MT4 EA is high quality professional trading system geared to generate returns without using GRID or martingales. Each trade has strict risk per trade parameter. The pairs under management include EURUSD, GBPUSD, AUDCAD, AUDNZD,GBPAUD, EURAUD, EURCAD, CHFJPY and many more.
The system is trading live: LIVE ACCOUNT TRACKING
You can run it free. Apply for a free trial and track our account. Buy the system or use profit share mechanism to generate returns on your MT4.
Join Our Telegram Group
")


