#GBPUSD @ 1.25642 The bounced off daily lows at 1.2446 and reclaimed 1.2500. (Pivot Orderbook analysis)
…
This is a premium post.
[s2If !current_user_can(access_s2member_level4)]Please register for FREE REGISTER to read full post below containing analysis. In case of any error or you think you are not able to read the full post below, please email us at support#nehcap.com [lwa][/s2If] [s2If current_user_can(access_s2member_level1)]
- The GBP/USD bounced off daily lows at 1.2446 and reclaimed 1.2500.
- GBP/USD Price Analysis: Bullish above 1.2500, with buyers eyeing the 200-week EMA above 1.2800.
The pair currently trades last at 1.25642.
The previous day high was 1.25 while the previous day low was 1.2436. The daily 38.2% Fib levels comes at 1.2476, expected to provide support. Similarly, the daily 61.8% fib level is at 1.2461, expected to provide support.
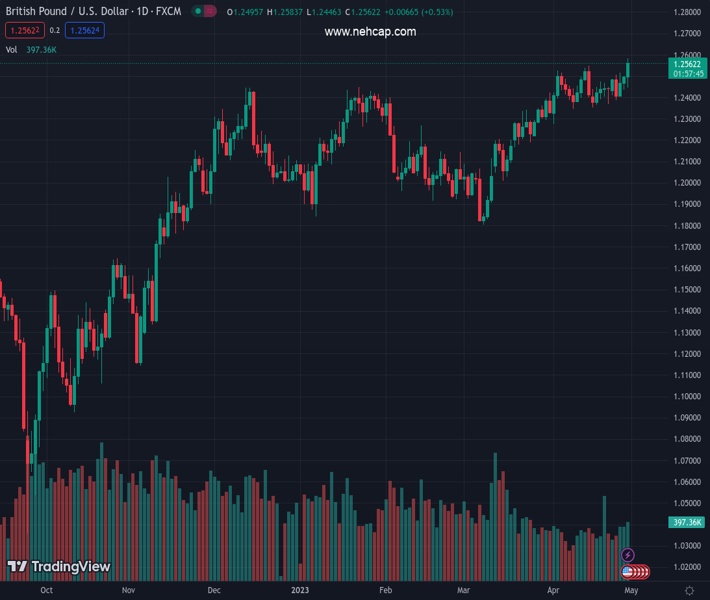
The GBP/USD soared to fresh YTD highs at 1.2583 despite fundamental news from the United States (US) increasing the likelihood of a Federal Reserve 25 bps rate hike. Therefore, the GBP/USD is trading at 1.2571, above its opening price by 0.61%.
The GBP/USD daily chart remains upward-biased from a technical perspective. After dipping to the 20-day EMA at 1.2477, the GBP/USD surged past the 1.2500 mark, despite the US Dollar (USD) strengthening after high inflation data.
The Relative Strength Index (RSI) indicator is still in bullish territory and aims higher, justifying higher GBP/USD prices. If GBP/USD cracks the 1.2600 figure, it would be cheered by buyers, which will set their eyes on the 200-week EMA at 1.2817.
Conversely, if the GBP/USD tumbles below 1.2500, that will expose the 20-day EMA at 1.2427, followed by 1.2400. A breach of the latter will expose the 50-day EMA at 1.2315, followed by the 1.2300 figure ahead of the confluence of the 200/100-day EMAs, each at 1.2188/1.2203, respectively.
Technical Levels: Supports and Resistances
GBPUSD currently trading at 1.257 at the time of writing. Pair opened at 1.2497 and is trading with a change of 0.58 % .
| Overview | Overview.1 | |
|---|---|---|
| 0 | Today last price | 1.2570 |
| 1 | Today Daily Change | 0.0073 |
| 2 | Today Daily Change % | 0.5800 |
| 3 | Today daily open | 1.2497 |
The pair remains strongly bullish on the daily timeframe. It trades above its 20 SMA @ 1.2439, 50 SMA 1.224, 100 SMA @ 1.2209 and 200 SMA @ 1.1937.
| Trends | Trends.1 | |
|---|---|---|
| 0 | Daily SMA20 | 1.2439 |
| 1 | Daily SMA50 | 1.2240 |
| 2 | Daily SMA100 | 1.2209 |
| 3 | Daily SMA200 | 1.1937 |
The previous day high was 1.25 while the previous day low was 1.2436. The daily 38.2% Fib levels comes at 1.2476, expected to provide support. Similarly, the daily 61.8% fib level is at 1.2461, expected to provide support.
Note the levels of interest below:
- Pivot support is noted at 1.2456, 1.2414, 1.2392
- Pivot resistance is noted at 1.2519, 1.2541, 1.2583
| Levels | Levels.1 |
|---|---|
| Previous Daily High | 1.2500 |
| Previous Daily Low | 1.2436 |
| Previous Weekly High | 1.2474 |
| Previous Weekly Low | 1.2354 |
| Previous Monthly High | 1.2424 |
| Previous Monthly Low | 1.1803 |
| Daily Fibonacci 38.2% | 1.2476 |
| Daily Fibonacci 61.8% | 1.2461 |
| Daily Pivot Point S1 | 1.2456 |
| Daily Pivot Point S2 | 1.2414 |
| Daily Pivot Point S3 | 1.2392 |
| Daily Pivot Point R1 | 1.2519 |
| Daily Pivot Point R2 | 1.2541 |
| Daily Pivot Point R3 | 1.2583 |
[/s2If]
Nehcap Expert Advisor
The NEHCAP MT4 EA is high quality professional trading system geared to generate returns without using GRID or martingales. Each trade has strict risk per trade parameter. The pairs under management include EURUSD, GBPUSD, AUDCAD, AUDNZD,GBPAUD, EURAUD, EURCAD, CHFJPY and many more.
The system is trading live: LIVE ACCOUNT TRACKING
You can run it free. Apply for a free trial and track our account. Buy the system or use profit share mechanism to generate returns on your MT4.
Join Our Telegram Group
")


